BTC Whale Wallet Shorts Market with $119.7M amid Bullish Momentum

1 0
Read Time:1 Minute, 8 Second

A Bitcoin whale has opened a bold $119.7 million short position amid BTC’s strengthening bullish momentum. What does this whale know?


Bitcoin is flashing signs of strengthening bullish momentum as institutions rush to accumulate the “digital gold” for their strategic reserves. Bitcoin maximalists and analysts have argued that BTC could cross the psychological $100k for the last time and might never drop below it again. Despite the BTC’s bullishness, a whale has caught the market’s attention after entering a massive short position.


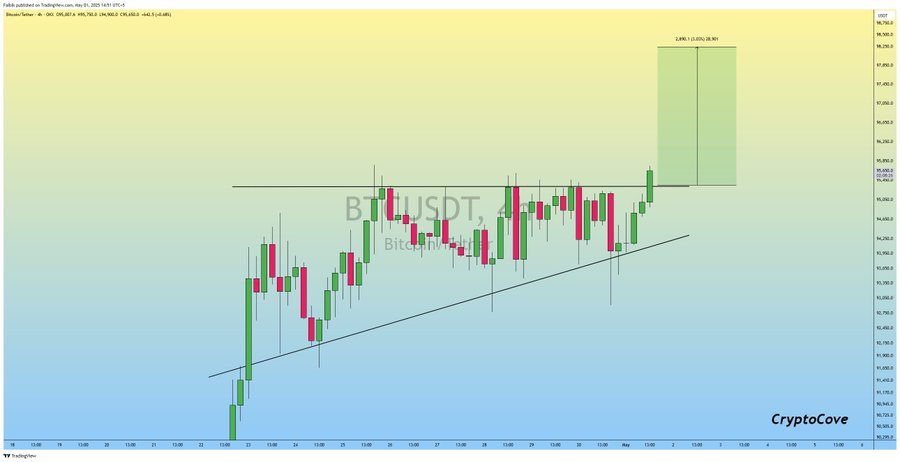
BTC is trading at around $95,557 with a 16.61% surge in trading volume over the past 24 hours, at press time, per CoinMarketCap. According to On-chain data, the whale wallet has executed its $119.7 million short position using 40X leverage. The entry price is $95,381 with liquidation set at $102,340.

Source: X


As Bitcoin’s price rises, the whale’s bet could signal a possible resistance ahead. This could mean an incoming bulls and bears battleground in the $95k-$102k range as BTC rallies in this zone. With the liquidation level set just 7% above the entry, this whale could be banking on BTC’s short-term pullbacks.

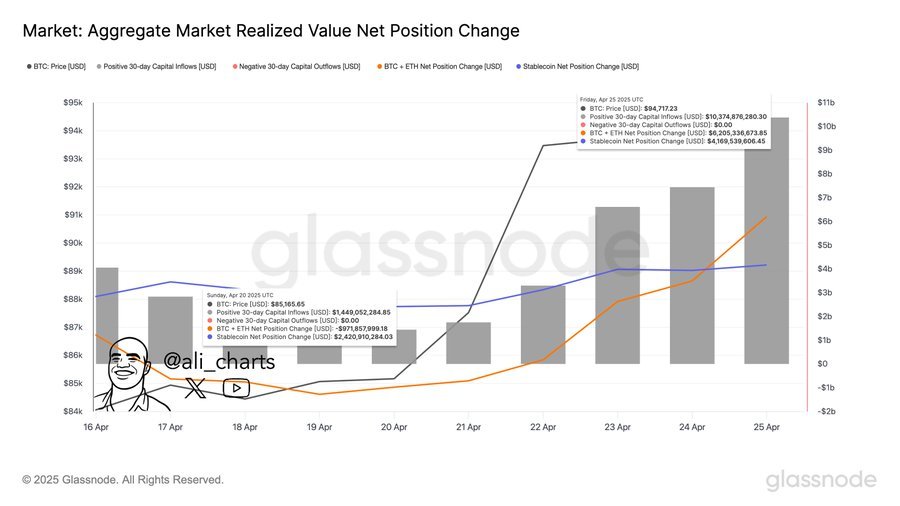
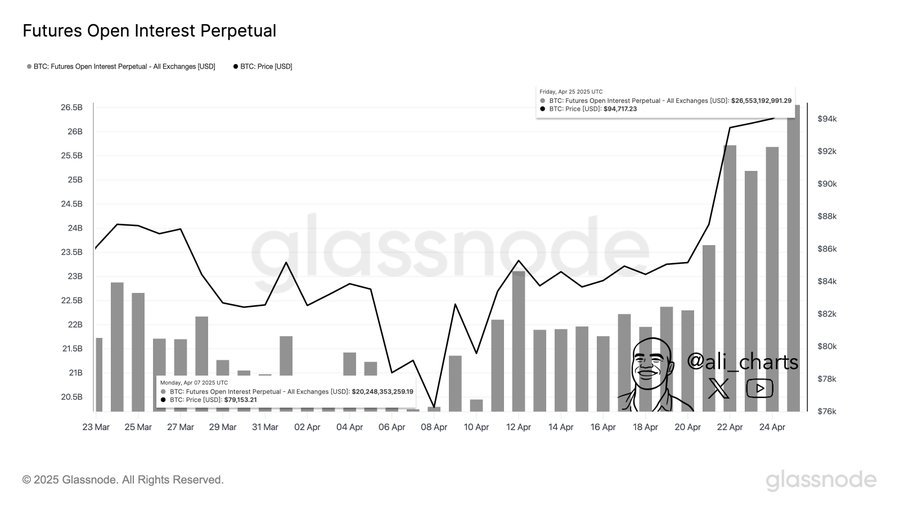
Traders are digging for insightful on-chain data and observing substantial market inflows for more clues, while retail sentiment remains bullish.

Happy
0 0 %
Sad
0 0 %
Excited
0 0 %
Sleepy
0 0 %
Angry
0 0 %
Surprise
0 0 %

Ethereum ICO Whale Dumps $4.5M ETH amid Institutional Buys

1 0
Read Time:59 Second

A major Ethereum ICO investor has offloaded $ 4.5M in ETH while BlackRock buys $20M worth of ETH, sparking mixed reactions in the market.


An early Ethereum initial coin offering(ICO) investor has made a surprising market move, leaving crypto investors with mixed reactions regarding ETH and his motives. According to On-chain data, the wallet sent 1,500 ETH ($2.76M) to the Kraken exchange. Previously, in the same 24-hour period, the whale wallet had transferred another 1,000 ETH ($1.83M), signalling significant offloading.


Source: X


The market has reacted to the whale wallet’s moves with mixed reactions. Having been an early ICO investor, traders question his motives, considering BlackRock has bought 11,000 ETH worth over $20 million in the same period.

BlackRock has been growing its Ethereum fund while other institutions like Trump’s World Liberty Financial believe in Ethereum’s rebound following a historical dip in Q1, 2025. So, does this early investor lack confidence in ETH’s bounce-back while institutional buying starts? Traders are closely watching ETH’s price at the $ 1800-1850 resistance zone to understand its next moves.

Happy
0 0 %
Sad
0 0 %
Excited
0 0 %
Sleepy
0 0 %
Angry
0 0 %
Surprise
0 0 %

TRON TRX Eyes Breakout while THIS Pattern Suggests a 15% Rally

1 0
Read Time:1 Minute, 11 Second

TRX is testing a key resistance zone on its bullish pennant pattern, eyeing a 15% rally post-breakout.


TRON (TRX) is catching the market’s attention following its listing as the 10th largest coin by market cap on CoinMarketCap’s cryptocurrencies list. In the past 24 hours, TRX has surged 1.25% with a 4.87% increase in its open interest. Per Coinalyze data, the Coin’s 24-hour long-short ratio stands at 2.27, suggesting heightened buying pressure.


Looking at the 4-hour chart, TRX’s price is consolidating in a bullish pennant pattern. This technical step up indicates a calm balance between sellers and buyers following a price uptrend. As of press time, TRON is trading at $0.2480 and attempting a breakout above the $0.2500 resistance zone.

Source: X


According to renowned analyst World of Charts, a breakout above the resistance zone could see TRX  rally 15% towards the $0.2800 and beyond in the short term. The MACD(12,26) is flashing a “sell” signalling some bearish pressure.

However, the short-term, mid-term, and long-term moving averages flash “strong buy”. With the Relative Strength Index (RSI) standing at 53 (neutral zone), TRX is not overbought and has more buying potential. TRON could be geared up for a rally soon, and traders are closely monitoring its price action at the resistance zone.


Happy
0 0 %
Sad
0 0 %
Excited
0 0 %
Sleepy
0 0 %
Angry
0 0 %
Surprise
0 0 %

Bearish Sentiment Rises as 63.76% of Binance Traders Bet Against Bitcoin

1 0
Read Time:51 Second

Latest data reveals a declining BTC long-to-short ratio as bears take charge of Binance trade positions.


Bitcoin traders on the world’s largest exchange by volume reveal a shift in market sentiment as Bitcoin approaches the psychological $100k Mark. Bitcoin is rallying towards $98,000, where short-term resistance exists before moving to $100k and above. According to recent data, 63.76% of traders on Binance have opened short positions for BTC price action.


Source: X


A low long-short ratio suggests prevailing bearish momentum in the market.  BTC is currently trading at  $96,989 with a nearly 1% increase in price over the past 24 hours, per CoinMarketCap. Bitcoin’s path to 100k could trigger major liquidations and some market volatility.

With the bulls and bears getting in a tug of war, the market is closely watching BTC’s price action at the current price for further insights. A Change in market sentiment could hint at price volatility soon.

Happy
0 0 %
Sad
0 0 %
Excited
0 0 %
Sleepy
0 0 %
Angry
0 0 %
Surprise
0 0 %

SUI Surges 9% as 21Shares Files for SUI ETFs

1 0
Read Time:49 Second

Sui has surged 9% following a partnership between the SUI Network and 21Shares.


On April 30, 21Shares, the crypto exchange-traded products (ETPs) firm, announced a partnership with the SUI network. The strategic collaboration aims at advancing high-performance blockchain utility in institutional finance. 21Shares has moved ahead to file for SUI  Exchange Traded Fund (ETFs) under the Form S-1 registration statement with the U.S. Securities and Exchange Commission (SEC).


Following this Development, SUI has surged 9% in the past 24 hours as of this writing, according to CoinMarketCap Data. The coin is attempting a breakout above the $3.50-$3.70 key resistance zone, with price fluctuating around this level.  Per Coinglass data, the Coin’s open internet has surged nearly 10%, signaling rising market optimism.

With the Open Interest (OI)-Weighted Funding Rate turning positive, SUI’s bullish momentum could be strengthening. Traders are watching the buying pressure and the market’s response to this news to determine their next moves.

Happy
0 0 %
Sad
0 0 %
Excited
0 0 %
Sleepy
0 0 %
Angry
0 0 %
Surprise
0 0 %

Bitcoin Price Analysis: What’s Next after THIS Breakout?

1 0
Read Time:1 Minute, 6 Second

BTC has broken above its ascending triangle following 9 days of price consolidation. Is a bull run to $100k on the horizon?


Bitcoin is signaling strength and could be eyeing a bull run towards the $100k  key psychological zone.  BTC is trading at around $95,994 as of press time, per CoinMarketCap data. In the past 24 hours, Bitcoin’s trading volume has surged 33.83% percent signalling increased market participation amid a breakout.

Looking at the 4-hour chart, the king of cryptocurrencies has broken above an ascending triangle pattern formation around the $95,650 key resistance level with strong bullish candles. The short-term, mid-term, and long-term moving averages signal a “strong buy” with the Relative Strength Index (RSI) standing at 69. This suggests more buying potential.

Source: X


With a +4.71% open interest, Bitcoin’s rising demand could fuel a rally towards the psychological $100k soon. The long-short ratio stands at 1.0404 per Coinglass data, suggesting that some bearish pressure exists.

According to crypto analyst CaptainFaibik on X (formerly Twitter), if the breakout momentum holds, BTC could be eyeing the $98,000 zone as the next target. Traders are closely monitoring the buying pressure above the breakout zone for further insights.


Happy
0 0 %
Sad
0 0 %
Excited
0 0 %
Sleepy
0 0 %
Angry
0 0 %
Surprise
0 0 %

Hyperliquid Attempts Breakout above $19-Will the Bulls Push Through?

1 0
Read Time:1 Minute, 0 Second

HYPE has surged 8% in price, with a high trading volume, while testing a key resistance zone. This suggests potential accumulation amid an upcoming ecosystem fee discount.


Hyperliquid, the rising decentralized finance ecosystem, has made a major announcement regarding the future of crypto trading on its network. The ecosystem announced plans to launch a new fee discount on May 5. Following this news, traders have shown optimism and are potentially accumulating the coin in anticipation of more gains.

The daily chart shows HYPE has bounced off a key support zone twice, indicating a price reversal. The coin’s bullish momentum has strengthened, and it is testing the $19 key resistance zone as the bulls step in cautiously.


Source: CoinMarketCap


According to renowned crypto analyst, Solberg Invest, a confirmed breakout above the $19 key resistance zone could see HYPE rally to $36 in the mid-term. Following the recent discount announcement, HYPE could break this zone and begin its rally.

With the MACD (12,26) and moving averages suggesting a “strong buy”, Hyperliquid is geared up for a rally. Traders are closely monitoring HYPE at the $19 resistance zone for further insights.

Happy
0 0 %
Sad
0 0 %
Excited
0 0 %
Sleepy
0 0 %
Angry
0 0 %
Surprise
0 0 %

Crypto Market Weekly Capital Inflow Hit $9B amid Renewed Investor Interest

1 0
Read Time:54 Second

The crypto market has seen a positive capital inflow of nearly $9 billion, suggesting heightened investor interest and confidence.


Following weeks of mixed signals, the crypto market is flashing signs of a boom. A fresh capital inflow into the market signals rising investor optimism and growing confidence in the brewing bullish momentum. Recent Glassnode data has revealed a $9 billion surge in positive capital inflow in the market.


Source: X


Bitcoin and Ethereum have led the market in capital inflow in the past week, with the stablecoin market rallying behind. When new capital enters the market, the prices of cryptocurrencies tend to surge as demand rises. Fresh capital inflow suggests potential accumulation of digital assets by both retail and institutional investors.

While the market may not see an immediate price upsurge, the rising demand could trigger price rallies in the next few days as the long-short ratio increases. Selling pressure tends to decrease as investors take note of the capital inflow metric in anticipation of higher gains.

Happy
0 0 %
Sad
0 0 %
Excited
0 0 %
Sleepy
0 0 %
Angry
0 0 %
Surprise
0 0 %

BTC Futures Monthly Open Interest Surges 20%- What’s does this Suggest?

1 0
Read Time:53 Second

Bitcoin futures open interest has surged 20% in the past 20 days, hitting over $26 billion, signalling increased activity in leveraged trading.


A look into Bitcoin’s on-chain activity signals a market shift among traders, with leverage heating up in April compared to Q1, 2025. According to data shared by crypto analyst Ali Martinez on X (formerly Twitter), BTC’s open interest jumped 20% over the past 20 days, topping $26 billion today.


Source:X

So, what does this mean?

With leveraged positions heating up, traders are pouring heavy capital into bets on BTC’s next moves. This means BTC’s movement in either direction could trigger serious liquidations and price volatility. Historically, the market experiences short squeezes or long squeezes, setting the stage for explosive price volatility.

While Bitcoin’s price is on the rise, more opportunities present themselves, but with associated risks. Leveraged positions signal increased investor confidence in BTC’s price movements but also present market volatility. Traders are closely monitoring liquidation pools for further insights.


Happy
0 0 %
Sad
0 0 %
Excited
0 0 %
Sleepy
0 0 %
Angry
0 0 %
Surprise
0 0 %

Greed and Fear Index: Crypto Market Sentiment Turns Neutral

1 0
Read Time:52 Second

The fear and greed index is significant in determining the emotional state of investors to establish market valuation.


The crypto market has seen unprecedented volatility in the past few weeks, leading to extreme fear, with the values dropping to 19. However, CoinMarketCap has noted a shift in the market sentiment in the past 72 hours. The fear and greed index has surged to 53, a neutral zone value. This data is critical in establishing whether the market is undervalued(fear) or overvalued (greed).


Source: CoinMarketCap


Historically, the shift from fear to neutral comes before a period of steady market growth and bullish market rallies. This shift is evident in BTC’s rising prices while eyeing the psychological $100k mark.

The current value suggests that the market is not yet overvalued (greedy), has more potential for buying, and the bull rally is likely starting. With rising institutional interest and huge BTC demand from the U.S investors, the market is shifting to a healthier stage.

Happy
0 0 %
Sad
0 0 %
Excited
0 0 %
Sleepy
0 0 %
Angry
0 0 %
Surprise
0 0 %
Exit mobile version