ONDO Surges 21% amid THIS Breakout-Is $1.2 Next on the Cards?

1 0
Read Time:1 Minute, 1 Second

ONDO has broken out of its downtrend to rally behind other recovering altcoins with a 25% price surge as the market sentiment shifts.


Ondo Finance, the U.S.-based provider of decentralized finance investment, has seen renewed market interest following a price reversal after months of downtrend. ONDO has gained 21% in price with a 70% surge in 24-hour trading volume. Per CoinGlass data, the coin’s open interest rose 19.92 % amid a positive Open Interest (OI) Weighted Funding Rate.

Looking at the 1-day chart, ONDO’s price has been consolidating inside a descending triangle pattern. On its descending trendline, a breakout above the $0.82 zone has seen ONDO rally towards the $1.0 resistance zone.


Source: CoinMarketCap


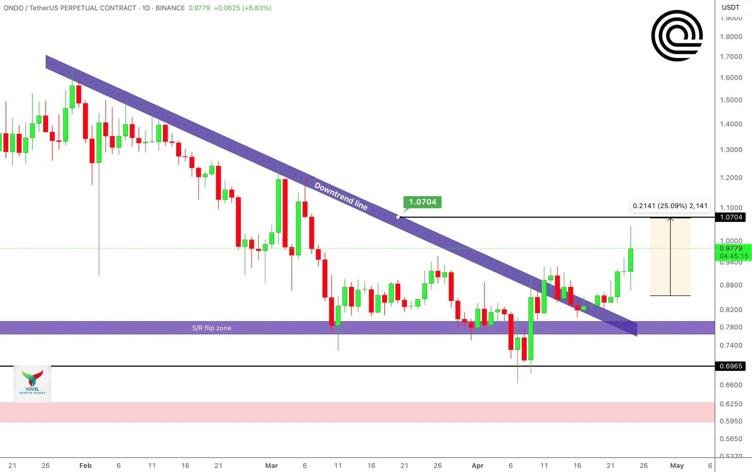
According to  Yovel Crypto Money on CoinMarketCap, despite the price consolidation at the $0.97 zone and momentum exhaustion, ONDO is eyeing the $1.0704 while targeting the $ 1.2 in the mid-term.

As the bulls step in, a high buying pressure could see the coin rally past the psychological $1.0 mark towards $1.2 and beyond. Traders are monitoring the price at the current price for further insights.

Happy
0 0 %
Sad
0 0 %
Excited
0 0 %
Sleepy
0 0 %
Angry
0 0 %
Surprise
0 0 %

AAVE: What’s Next for Aave after THIS Breakout?

1 0
Read Time:53 Second

Aave has broken out of its falling wedge pattern on the daily timeframe. With a high trading volume and price upsurge, what’s the next target?


In the past 4 months, AAVE’s price has been consolidating in a falling wedge pattern on the daily chart. In the last 24 hours, Aave has surged nearly 9% with a 39.56% increase in trading volume, at press time, per CoinMarketCap data. This follows a breakout above the $135 resistance zone on its descending trendline.


Source: X


As of this writing, Aave was trading at $166.13, with the short-term and mid-term moving averages flashing “buy.”  While Aave could be eyeing the psychological $200 key resistance zone, Crypto analyst Adam Horton has predicted $312 as the coin’s long-term target.

With the 24-hour Relative Strength index standing at 59 and open interest rising by 10.8%, the market shows bullish momentum and has more potential for buying. Traders are closely watching AAVE’s next move following this breakout.

Happy
0 0 %
Sad
0 0 %
Excited
0 0 %
Sleepy
0 0 %
Angry
0 0 %
Surprise
0 0 %

SUI Flashes Signs of Strength amid Rising Investor Interest

1 0
Read Time:59 Second

Sui has seen a 135% surge in 24-hour trading volume with an increased long-short ratio. Why is Sui pumping?


SUI has witnessed significant on-chain growth fueled by growing interest in its layer 1 blockchain capabilities. The coin has seen a 135% increase in trading volume, with its 24-hour long-to-short ratio rising to 2.05, at press time, per Coinalyze data. This suggests that the market saw more SUI buyers than Sellers in the past 24 hours, pumping the coin’s price by 5%.

So, why is SUI surging?

Looking at the charts, Sui has broken out of a descending wedge pattern on the daily chart. With the crypto market showing recovery after the trade tariff war, SUI’s breakout could mean a bull rally in the coming days. Technical analysis reveals $4 as the coin’s target in the coming days.


Source: X


Following the breakout, many investors are betting on SUI’s uptrend in the coming weeks. A surge in trading volume and buying pressure is indicative of accumulation. There has been heightened investor conviction in the network’s long-term growth.

Happy
0 0 %
Sad
0 0 %
Excited
0 0 %
Sleepy
0 0 %
Angry
0 0 %
Surprise
0 0 %

Aptos APT Surges amid Rising Network Stablecoin Supply

1 0
Read Time:54 Second

Aptos has surged 4.02% with a high trading volume as the network’s stablecoin supply hits $1 billion.


Aptos, a layer 1 proof-of-stake (PoS) blockchain using smart contracts to boost web3 adoption, has seen its token APT surge 4.02% in the past 24 hours. APT has been trading inside a falling wedge pattern on the daily chart in Q1, 2025, and has broken out with a 25% surge in trading volume.


Source: X


Aptos was consolidating at around $5.11 as of this writing, per CoinMarketCap. Technical analysis suggests $6 as APT’s mid-term target while eyeing $9.7 following this breakout. According to Crypto King25, the total supply of natively minted USDC and USDC on the network has hit $1 billion.


Source: CoinMarketCap


Following a breakout and high stablecoin supply on the network, Aptos could be poised for an uptrend in the following weeks. Traders a closely watching APT’s next move following this breakout.

Happy
0 0 %
Sad
0 0 %
Excited
0 0 %
Sleepy
0 0 %
Angry
0 0 %
Surprise
0 0 %

Oversold Alert: Why Ethereum Could Be Rallying Soon

1 0
Read Time:1 Minute, 2 Second

Ethereum’s monthly Relative Strength Index(RSI) has dropped to its most oversold ever, and whales are accumulating the dip. So, are ETH bulls rallying soon?


Ethereum has seen its price drop significantly as of Q1 2025. Despite other altcoins rallying after the trade war freeze, the king of altcoins saw a price exhaustion in a recovery attempt. As of this writing, ETH is trading at $1583 per CoinMarketCap data.

Looking at Ethereum’s 8-hour chart, the coin has been consolidating inside a descending channel pattern in Q1, 2025.

Source: X


With the price dropping to a 2-year low, ETH’s Relative Strength Index(RSI) has dropped to 40. This suggests that the coin is oversold, leaving the price in trenches. The bulls have stepped in as Ethereum’s momentum and MACD(12,26) flash “buy”.

According to CryptoGoos on X (formerly Twitter):


WHALES HAVE BOUGHT OVER 200,000 $ETH IN THE LAST 3 DAYS. THEY’RE BUYING THE DIP!


With potential whale accumulation in the dip, ETH can break above the $1650 key resistance zone on its descending channel pattern. A confirmed breakout could see ETH rallying to $2800 in the next few weeks.


Happy
0 0 %
Sad
0 0 %
Excited
0 0 %
Sleepy
0 0 %
Angry
0 0 %
Surprise
0 0 %

Polkadot Flashes Breakout Signals-Is $4.8 the Next Target?

1 0
Read Time:55 Second

Polkadot is testing a key resistance level on its falling wedge with high trading volume, suggesting a strong breakout.


Polkadot, the blockchain network that bridges other blockchain networks, has caught the market’s attention following a 57.5% surge in trading volume in the past 24 hours. Per CoinMarketCap, DOT was trading at $3.82, a 2.47% price increase, as of press time.

DOT’s price has been trading inside a falling wedge pattern formation for the past 4 months. Looking at the 12-hour chart, the price is consolidating and testing the $4.10 key resistance zone on its descending resistance trendline.


Source: CoinMarketCap


Technical analysis by WorldofCharts suggests that $4.8 could be Polkadot’s next target following a confirmed successful breakout above its falling wedge formation.

With the MACD level (12,26) and short-term moving averages flashing “buy”, DOT could be geared up for an uptrend rally soon. One should watch out for the coin’s buying pressure and open interest at this level while the market awaits a confirmed breakout.

Happy
0 0 %
Sad
0 0 %
Excited
0 0 %
Sleepy
0 0 %
Angry
0 0 %
Surprise
0 0 %

Bitcoin Dominance Signals a Reversal- What’s next?

1 0
Read Time:51 Second

Bitcoin dominance is on the verge of a breakdown on the charts. Could this spark the next altseason?


Bitcoin dominance chart has been useful in predicting the crypto market cycles. Looking at the current chart setup, Bitcoin’s market dominance is hitting a critical resistance, hinting at a potential reversal.

A decline in Bitcoin dominance means that liquidity has shifted its flow to altcoins, and  BTC’s market share is shrinking. With the BTC dominance chart hitting a key resistance zone, does this mean the market could see altcoins boom soon?


Source: X


According to renowned analyst CryptoGoos:

THE BITCOIN DOMINANCE IS ABOUT TO CRASH. BULLISH FOR ALTS!


BTC  has seen its open interest decrease by 2.7% and price drop by 0.9%. The long-short ratio stands at 0.97, showing a slight selling pressure in the last 24 hours, as of press time. The market is closely watching BTC’s next moves at this point for further insights.

Happy
0 0 %
Sad
0 0 %
Excited
0 0 %
Sleepy
0 0 %
Angry
0 0 %
Surprise
0 0 %

Cardano ADA Eyes 30% Price Surge in THIS Pattern-What’s next?

1 0
Read Time:49 Second

 Cardano’s price is consolidating inside a symmetrical triangle in the hourly chart. Analyst predicts a 30% upsurge in the next few days.


Over the past two weeks, ADA has been consolidating inside a symmetrical triangle on its hourly chart and is approaching a breakout. This follows a retest of its ascending trendline within this pattern formation. In the past 24 hours, the coin has seen its open interest rise 3.13% per Coinglass data.


Source: X


According to his technical analysis, analyst Ali Martinez predicts ADA could rally 30% following a retest of its ascending support trendline as the bulls step in to strengthen the uptrend momentum.

If ADA closes above $0.64 with high buying pressure, this is possible in the next few hours to days. However, one should watch out for any signs of exhaustion, where a decisive drop under $60 could lead to a further downside.

Happy
0 0 %
Sad
0 0 %
Excited
0 0 %
Sleepy
0 0 %
Angry
0 0 %
Surprise
0 0 %

Over $2.25B in BTC and ETH Options to Expire- Volatility Storm Coming?

1 0
Read Time:53 Second

23,000 BTC and 177,000 ETH options are set to expire today. Is a price volatility on the horizon?


April 18th- The crypto market is at a critical moment with massive options anticipating expiry. Traders are closely watching price action with expectations of potential sharp price movements. With many altcoins having notable price correlation with Bitcoin, the ripple effect could spread accross the market.

According to Crypto Rover on X (formerly Twitter):


23,000 $BTC OPTIONS WORTH $1.97B AND 177,000 $ETH OPTIONS WORTH $280M EXPIRE TODAY, EXPECT MASSIVE VOLATILITY!


ETH is currently trading between two major supply zones, that is $1,540 and $1,630. Crypto analyst Ali Martinez has shared this insight, citing that a breakout on either side could define the next move for the king of altcoins.


Source: X


With Bitcoin and Ethereum leading the crypto market, significant volatility affecting their prices is a market concern. Investors are closely monitoring the market to make their next moves.

Happy
0 0 %
Sad
0 0 %
Excited
0 0 %
Sleepy
0 0 %
Angry
0 0 %
Surprise
0 0 %

Hyperliquid (HYPE) Holds Key Support- Is $36 Next on the Cards?

1 0
Read Time:55 Second

Hyperliquid surges 8.67% with a high trading volume after retesting and bouncing off a key support. Technical analysis hints at $36 as a long-term target.


Hyperliquid, the high-performance decentralized perpetuals exchange, has seen its token, HYPE, surge 8.67% in the past 24 hours, as of this writing. Per CoinMarketCap data, the coin’s trading volume has risen 28.41% following a retest and bounce-off at the $12-$13.5 key support zone on the daily chart.


Source: CoinMarketCap


According to technical analyst Solberg Invest, with the momentum building, traders are eyeing the $19-$27 key resistance zone in the mid-term while targeting $36 in the long-term.

Derivatives data by Coinglass signals heightened open interest (+10.12%) as HYPE’s Open Interest (OI) Weighted Funding Rate turns positive.

With prices fluctuating around the $16.7  level, hype could be geared up for a rally soon. One should watch for the coin’s buying volume, open interest, and Relative Strength Index(RSI) in the current setup to understand HYPE’s next moves.

Happy
0 0 %
Sad
0 0 %
Excited
0 0 %
Sleepy
0 0 %
Angry
0 0 %
Surprise
0 0 %
Exit mobile version