Ethereum Price Prediction Report: Technical Analysis & Market Insights

0 0
Read Time:2 Minute, 3 Second

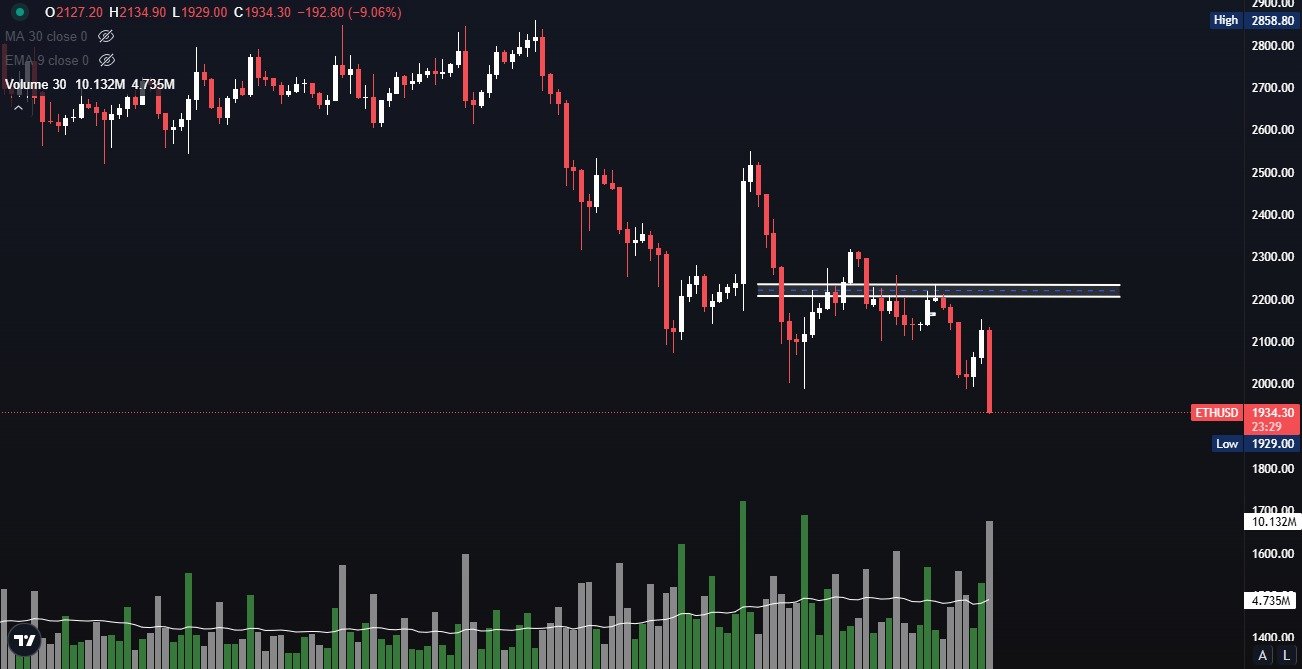
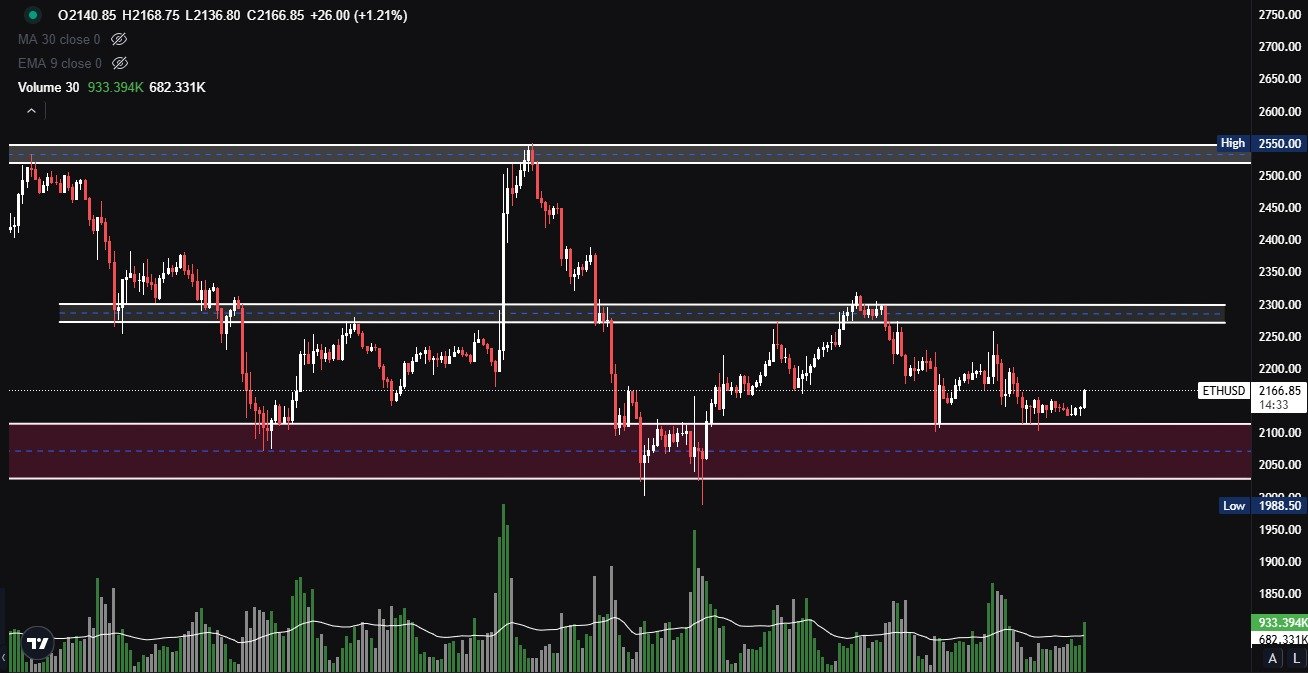
Ethereum (ETH) is currently trading at $1,884, with price action consolidating within the $1,820 – $1,950 range over the past 4-5 days. This period of tight consolidation suggests that an explosive move could be imminent, either to the upside or downside.

The global economic uncertainty, trade wars, and macroeconomic factors continue to impact market sentiment, making risk management crucial for traders.

Technical Levels:

Support Zones:

  • $1,800 – $1,820 → Strong support level where buyers are holding firm.
  • $1,740 – $1,750 → Next potential downside target if the key support at $1,800 fails.

Resistance Zones:

  • $1,950 – $1,960 → Immediate resistance level.
  • $2,000 → Critical psychological and technical hurdle.
  • $2,100 → Upside target if ETH breaks and holds above $2,000.

Indicator Readings:

  • Moving Averages (MA): Short-term moving averages indicate a bearish crossover, suggesting downside momentum.
  • Relative Strength Index (RSI): The RSI is approaching oversold territory, indicating a potential rebound from support levels.
  • Volume Analysis: Declining volume near resistance and support levels suggests a possible breakout or breakdown is imminent.

Potential Price Scenarios:

  1. Bullish Breakout:
    • If Ethereum breaks above $2,000 and sustains momentum, it could trigger a rally toward $2,100.
    • A confirmed breakout above $2,100 could set the stage for a move toward $2,200 – $2,250 in the coming weeks.
  2. Bearish Breakdown:
    • If Ethereum fails to hold the $1,800 support level, a breakdown could push the price toward $1,740 – $1,750.
    • A sustained move below $1,740 would open the doors for further downside, possibly retesting the $1,700 – $1,680 range.

Market Sentiment & Trading Strategy:

  • Volatility Alert: The ongoing price compression signals a potential volatility surge. Traders should prepare for a significant move.
  • Risk Management: Utilize stop-loss orders, maintain a hedging strategy, and avoid directional bias in this uncertain market environment.
  • Confirmation is Key: To reduce risk exposure, wait for a confirmed breakout or breakdown before entering new positions.

Conclusion:

Ethereum’s price action is at a critical juncture, with traders closely watching the $1,800 support and $2,000 resistance levels. A breakout above $2,000 could trigger bullish momentum, while a breakdown below $1,800 could lead to further downside pressure.

With increasing macro uncertainties, traders need to adopt cautious and well-informed strategies. Stay updated and manage risk effectively in these volatile market conditions.

Disclaimer:

This report is for informational purposes only and should not be considered financial advice. Trade at your own risk.

Happy
0 0 %
Sad
0 0 %
Excited
0 0 %
Sleepy
0 0 %
Angry
0 0 %
Surprise
0 0 %

Bitcoin (BTC) Technical Analysis Report –15 March 2025

0 0
Read Time:1 Minute, 35 Second

Bitcoin (BTC) is currently trading at $84,450, showing signs of short term bullish momentum after breaking out from a 3-4 day consolidation between $80,000 and $84,000. The breakout above the $84,000 level on the 4-hour chart is a crucial indicator of potential price sustainability at higher levels.

Key Technical Levels:

  • Immediate Support: $83,800 – $84,000s
  • Major Resistance Zone: $84,500 – $84,700
  • Breakout Target: $86,000 – $86,500
  • Downside Support Zone: $79,000 – $80,000
  • Key Breakdown Level: $83,500

Technical Analysis Insights:

Bullish Scenario:

  • If Bitcoin closes above the $84,500 – $84,700 resistance zone, we can expect an upward continuation towards $86,000 – $86,500.
  • A sustained price movement above this level will reinforce bullish sentiment, attracting more buyers into the market.
  • The Relative Strength Index (RSI) at ~55.94 suggests there is room for further upside before reaching overbought conditions.

Bearish Scenario:

  • If Bitcoin fails to hold above $84,000 and breaks below $83,500, selling pressure may increase, leading to a retest of the $79,000 – $80,000 support zone.
  • If BTC starts falling from $84,000 – $84,500, it would indicate that short sellers remain dominant at higher levels, causing further price rejection.
  • Failure to sustain above $84K could trigger profit-booking and fresh short positions, leading to renewed bearish momentum.

Market Sentiment & Conclusion:

The recent breakout above $84,000 signals a potential shift towards a short-term uptrend, but Bitcoin still faces resistance at $84,500 – $84,700. Traders should closely monitor price action around these key levels.

  • Bullish confirmation: Sustained close above $84,700 for further upside towards $86,500.
  • Bearish confirmation: Break below $83,500 could trigger downside towards the $79,000 – $80,000 support zone.

A decisive move in either direction will determine the next major trend for BTC. Traders should use stop-losses and risk management strategies accordingly.

Happy
0 0 %
Sad
0 0 %
Excited
0 0 %
Sleepy
0 0 %
Angry
0 0 %
Surprise
0 0 %

Bitcoin (BTC/USD) Trading Signal & Report

0 0
Read Time:1 Minute, 48 Second

Bitcoin (BTC) is currently facing a critical resistance zone between $84,000 and $84,500, where strong selling pressure has been observed. Over the past three days, BTC has been trading within a range of $77,000 to $84,500, indicating a Compression Phase before a breakout or breakdown.

This consolidation phase suggests that a major price movement is imminent.

Bitcoin Price Analysis: Consolidation & Resistance Zones

Bitcoin is currently experiencing a strong supply zone around the $84,000 – $84,500 resistance level. If BTC manages to break and sustain above $86,000, it could trigger a bullish rally towards $90,000 and beyond. However, failure to break this level may lead to further consolidation or downside movement.

Support Levels:

  • $79,000 – $80,000: Currently acting as a key support zone.
  • $77,500: If BTC breaks below this level, further downside is expected.
  • $73,000 – $71,000: The next major support zone if bearish momentum intensifies.

Resistance Levels:

  • $84,000 – $84,500: Immediate resistance with strong selling pressure.
  • $86,000: A crucial breakout level; sustained price action above this could lead to a bullish trend.
  • $90,000: A potential price target if BTC successfully clears the $86,000 and sustains above in higher timeframe, then the price will reach 90k.

Market Outlook & Potential Price Movement:

  • Bearish Scenario: If BTC fails to hold the $79,000 – $80,000 support zone, and breaks below $77,500, the price could decline further toward $73,000 – $71,000.
  • Bullish Scenario: If BTC breaks above $86,000 and closes above this level on higher timeframes, bullish momentum could take BTC toward the $90,000 mark, attracting further buyer interest.

Final thoughts:

Bitcoin is consolidating between $77,000 and $84,500, indicating a Compression Phase before a breakout or breakdown. Traders should closely monitor the $86,000 resistance level for potential bullish confirmation or watch for a breakdown below $77,500 for a bearish move. With increased volatility expected, strategic risk management is crucial for both short-term and long-term traders.

Disclaimer: This analysis is for informational purposes only and should not be considered financial advice. Always conduct your research before making investment decisions.

Happy
0 0 %
Sad
0 0 %
Excited
0 0 %
Sleepy
0 0 %
Angry
0 0 %
Surprise
0 0 %

Ripple (XRP) Trading Signal & Technical Analysis

0 0
Read Time:1 Minute, 59 Second

Ripple (XRP) is currently exhibiting bearish momentum, continuously forming lower lows on the price chart. The price recently broke below $1.95, reaching a new low of $1.90. Following this, a pullback was observed, and the price is now consolidating within a narrow range.

Market participants should watch for key support and resistance levels to determine the next move.

Key Levels:

  • Immediate Support Zone: $1.90-$1.95 – This level is crucial for XRP. If it fails to hold, further downside movement is expected.
  • Next Major Support: $1.60-$1.70 – If the price breaks below the $1.90-$1.95 range, the next significant support lies in this region.
  • Immediate Resistance Zone: $2.28-$2.30 – A breakout above this level could push XRP towards higher resistance levels.
  • Next Resistance Zone: $2.48-$2.50 – If XRP successfully surpasses the $2.26-$2.30 resistance, the next target will be around this price range.

Technical Indicators:

  • Moving Averages:
    • The 30-period Moving Average (MA) is at $2.0989, reflecting a bearish trend.
    • The 9-period Exponential Moving Average (EMA) is at $2.1167, indicating that the price is trying to stabilize after the recent pullback.
  • Volume Analysis:
    • The trading volume has seen an increase, especially near recent lows, suggesting potential buying interest.
    • However, confirmation of a reversal would require sustained volume growth alongside a bullish price breakout.

Market Sentiment & Trend Analysis:

  • The current trend remains bearish, with XRP consistently making lower lows.
  • If XRP fails to hold the $1.90-$1.95 support, it could experience a deeper decline towards $1.60-$1.70.
  • On the upside, a strong breakout above $2.28-$2.30 would be the first indication of a possible bullish reversal.
  • To confirm a sustained uptrend, XRP needs to hold above $2.50 and establish higher highs.

Conclusion: Ripple (XRP) is at a critical support level between $1.90-$1.95. If this zone holds, a potential rebound could push the price towards $2.28-$2.30 and beyond to $2.48-$2.50. However, if selling pressure persists and the support level breaks, XRP could decline further towards $1.60-$1.70.

Traders should remain cautious and look for confirmation signals before taking long positions.

Disclaimer: This analysis is for informational purposes only and should not be considered financial advice. Always conduct your research before making any trading decisions.

Happy
0 0 %
Sad
0 0 %
Excited
0 0 %
Sleepy
0 0 %
Angry
0 0 %
Surprise
0 0 %

Solana (SOL/USD) Trading Signal: Technical Analysis

0 0
Read Time:1 Minute, 55 Second

Solana (SOL) has been experiencing a significant downtrend, with the price making a recent low at $112 following a strong sell-off. Currently, a pullback is occurring from this level, with SOL attempting to regain lost ground. However, the market remains bearish, and key resistance and support levels must be closely monitored.

Key Levels:

  • Immediate Resistance: $128-$130 – The price is currently testing this level. A breakout above this zone could push SOL towards higher resistance levels.
  • Next Resistance Zone: $145-$150 – If the price successfully breaches the $128-$130 resistance, this area will act as the next major hurdle.
  • Immediate Support: $110-$112 – This level has strongly supported the recent sell-off. If broken, a deeper decline is likely.
  • Major Support Level: $80-$85 – A breakdown below the $110-$112 support zone could send SOL towards this critical support area.

Technical Indicators:

  • Moving Averages:
    • The 30-period Moving Average (MA) is currently at $122.4529, indicating a bearish trend.
    • The 9-period Exponential Moving Average (EMA) is at $122.9541, suggesting that the price is attempting to consolidate after the recent sell-off.
  • Volume Analysis:
    • The volume profile indicates increased trading activity around the recent lows, which may signal potential accumulation.
    • However, higher volume with upward momentum is required for a confirmed trend reversal.

Market Sentiment & Trend Analysis:

  • The overall trend remains bearish, as evidenced by the consistent lower highs and lower lows.
  • Caution is advised against entering long positions until the price starts closing above $165-$170, which would indicate a potential trend reversal.
  • If SOL fails to break above the $128-$130 resistance, it could face renewed selling pressure, leading to a possible retest of lower support levels.

Conclusion: Solana (SOL) is currently facing key resistance at $128-$130, and a breakout above this level could open the door for further upside towards $145-$150. However, if SOL fails to clear this resistance, the price may decline towards $110-$112, with a further downside risk to $80-$85 in a prolonged bearish scenario.

Given the current market conditions, traders should exercise caution and wait for a confirmed bullish breakout above $165-$170 before considering long positions.

Disclaimer: This analysis is for informational purposes only and should not be considered financial advice. Always conduct your research before making any trading decisions.

Happy
0 0 %
Sad
0 0 %
Excited
0 0 %
Sleepy
0 0 %
Angry
0 0 %
Surprise
0 0 %

Ethereum (ETH) Price Prediction and Market Analysis

0 0
Read Time:2 Minute, 24 Second

Ethereum (ETH) is currently experiencing significant selling pressure as it struggles to hold critical support levels. The recent price action has been predominantly bearish, with ETH forming lower lows and failing to establish any meaningful upward momentum.

As of the latest data, ETH is trading around $1,934.30, reflecting a sharp decline of -9.06% in the past 24 hours. This steep drop is a direct consequence of breaking key support levels on the daily, weekly, and monthly charts, which has triggered an aggressive wave of selling pressure.

Technical Analysis: Ethereum Breakdown

Price Movement

  • Open: $2,127.20
  • High: $2,134.90
  • Low: $1,929.00
  • Close: $1,934.30
  • 24H Change: -9.06%

The chart analysis indicates Ethereum’s failure to reclaim key resistance levels, leading to a strong downward trend. The breakdown of multiple support levels has intensified selling, pushing ETH into uncharted bearish territory.

Key Support & Resistance Levels

  • Immediate Support: $1,900 (critical level)
  • Next Major Support: $1,700 (strong historical support)
  • Resistance Zone: $2,100 – $2,200

If Ethereum fails to sustain the $1,900 support level, the next downside target is $1,700, a key psychological and technical support level. However, any potential recovery will face strong resistance at $2,100 – $2,200, which previously acted as a support zone.

Volume & Market Sentiment

A surge in trading volume has accompanied this recent price drop, indicating strong bearish sentiment. The increased sell-side volume suggests that market participants are offloading their holdings, further adding to the downward pressure. Until a clear reversal pattern emerges, traders should exercise caution.

Future Price Predictions for Ethereum

Given the prevailing market conditions, ETH is likely to remain under pressure unless a strong buying force intervenes. The possible scenarios include:

  1. Bearish Scenario: If Ethereum breaks below $1,900, it could test $1,700, a historically strong support level. A failure to hold $1,700 may result in a further decline toward $1,500.
  2. Bullish Recovery: For ETH to regain bullish momentum, it must reclaim $2,100, with the next target being $2,500. However, given the ongoing market sell-off, the likelihood of a strong recovery in the near term remains low.

Investment Strategy: Should You Buy Ethereum Now?

With the market bleeding and ETH in a clear downtrend, it is advisable not to initiate long positions at the moment. Traders should wait for a confirmed reversal or strong support hold before considering any new entries. Risk management is crucial, and stop-loss levels should be strictly adhered to in case of further declines.

Conclusion: Ethereum Price Outlook

Ethereum is facing a critical moment as it struggles to hold key support levels. If $1,900 fails to sustain, ETH may extend its losses toward $1,700. Until the market stabilizes, caution is recommended. Traders and investors should closely monitor price action and volume indicators to make informed decisions.

Happy
0 0 %
Sad
0 0 %
Excited
0 0 %
Sleepy
0 0 %
Angry
0 0 %
Surprise
0 0 %

Bitcoin Price Prediction: (BTC) Technical Analysis Report

0 0
Read Time:1 Minute, 51 Second

The recent price action in Bitcoin (BTC) suggests significant selling pressure, with bears firmly in control. The market is displaying a pattern of lower highs and lower lows, reinforcing the ongoing downtrend.

Buyers appear to be on the weaker side, as each bullish attempt is met with strong resistance and subsequent rejection.

Key Observations from the Chart:

  1. Price Action & Trend Analysis:
    • BTC is currently trading near the support zone of $79,000 – $80,000.
    • If BTC breaks below $78,000, it could trigger a further sell-off, potentially dragging the price towards the next major support at $72,000 – $73,000.
    • On the upside, BTC faces immediate resistance at $83,000 – $84,000.
    • A breakout above this level could lead to a move toward the next resistance level at $87,000.
  2. Moving Averages:
    • The 30-period moving average (MA) is at $82,056.9, acting as dynamic resistance.
    • The 9-period Exponential Moving Average (EMA) is at $82,031.4, which is also trending downward, signaling continued bearish momentum.
  3. Volume Analysis:
    • Volume bars indicate a spike in selling activity, confirming the bearish dominance.
    • Increased volume on bearish candles suggests strong selling interest, reinforcing the possibility of further downside movement.
  4. Support & Resistance Levels:
    • Immediate Support: $79,000 – $80,000
    • Breakdown Level: $78,000 (Break below this could accelerate selling pressure toward $72,000 – $73,000)
    • Immediate Resistance: $83,000 – $84,000
    • Breakout Level: $87,000 (Above this level, BTC could push towards new highs)

Conclusion & Trading Outlook:

  • Bearish Scenario: If BTC loses the $78,000 support level, the next major downside target is $72,000 – $73,000. Given the prevailing selling pressure, traders should be cautious about entering long positions unless signs of a reversal emerge.
  • Bullish Scenario: A breakout above $83,000 – $84,000 could shift market sentiment and drive BTC towards $87,000. However, until this level is breached, the market remains bearish.
  • Recommendation: Traders should closely monitor $78,000 for a breakdown and $83,000 – $84,000 for a potential bullish reversal. Risk management is crucial in the current volatile environment.

Disclaimer: This analysis is for informational purposes only and does not constitute financial advice. Always conduct your research before making any trading decisions.

Happy
0 0 %
Sad
0 0 %
Excited
0 0 %
Sleepy
0 0 %
Angry
0 0 %
Surprise
0 0 %

XRP Price Prediction: Is a Major Breakout Coming?

0 0
Read Time:1 Minute, 57 Second

XRP Price Prediction has been a hot topic as XRP remains a dominant force in the crypto space, serving as a bridge between traditional finance and blockchain technology. With its price currently consolidating between $2.00 and $3.35, investors are eagerly watching for a breakout.

The question remains: Is now the perfect time to invest in XRP?

XRP Trading in a Symmetrical Triangle Pattern

In this XRP Price Prediction report, we analyze. The XRP is currently exhibiting a symmetrical triangle pattern, a classic indicator of an impending breakout. This pattern signifies that the asset is forming lower highs and higher lows, creating a narrowing trading range.

What Could Trigger the Breakout?

Several factors could determine XRP’s next move:

  1. Ripple vs. SEC Legal Battle: The ongoing lawsuit between Ripple and the U.S. SEC remains a crucial catalyst. Any positive developments could spark a price rally, while uncertainty may trigger a decline.
  2. Market Conditions: The broader crypto market plays a significant role in XRP’s movement. A strong Bitcoin performance could push XRP higher, whereas increased selling pressure could hinder its momentum.
  3. XRP ETF Developments: The possibility of an XRP ETF remains a hot topic. Any progress in this area could serve as a bullish catalyst.
  4. Strategic Reserve Announcement: The U.S. government’s strategic crypto reserve plans are expected to impact the entire crypto ecosystem. This could drive increased institutional and retail investment in XRP.

Key Technical Indicators & Resistance Levels

  • Supertrend Indicator: On the weekly chart, the Supertrend shows that XRP is still in the positive zone and appears ready for its next move.
  • Relative Strength Index (RSI): Currently at around 45, indicating a near-neutral zone. A rise above 65 would suggest strong buying pressure, while a drop below 40 could signal weakness.
  • Psychological Level: The $3 mark remains a key psychological resistance. A successful breach above $3.5 could set the stage for a rally toward $5, presenting a lucrative opportunity for investors.

 Is This the Right Time to Invest in XRP?

With XRP consolidating within a critical range and multiple catalysts on the horizon, investors are closely monitoring the next move. A breakout above $3.50 could pave the way for a $5 target, making XRP an attractive buy. However, staying updated on market trends and legal developments is crucial for making informed investment decisions.

Happy
1 100 %
Sad
0 0 %
Excited
0 0 %
Sleepy
0 0 %
Angry
0 0 %
Surprise
0 0 %

Bitcoin (BTC) Technical Analysis: 8 Mar 2025

0 0
Read Time:1 Minute, 36 Second

Bitcoin (BTC) is currently consolidating within a tight range of $85,200 – $86,900, indicating low volatility and reduced trading volume. This phase of consolidation suggests an impending breakout or breakdown, with price direction heavily dependent on volume confirmation.

Traders and investors should closely monitor key support and resistance levels to anticipate the next major move.

Bitcoin (BTC) Key Levels Analysis

Current Consolidation Zone: $85,200 – $86,900

  • BTC is trading in a narrow range, reflecting market indecision.
  • Volume remains low, signaling a lack of strong buying or selling pressure.
  • A breakout or breakdown from this range will determine the next directional move.

Upside Potential: Above $86,900

  • If BTC breaks above $87k with strong volume, it could trigger a move toward $90,000 – $91,000.
  • This level represents a key psychological resistance, where increased buying momentum may push the price higher.
  • Confirmation through high trading volume will be critical to sustain the move.

Downside Risk: Below $85k

  • A break below $85k could signal a bearish move, dragging BTC toward $82,000 – $83,000.
  • Selling pressure may intensify if the price fails to hold above this level.
  • Traders should monitor volume and market sentiment to gauge further downside risk.

Bitcoin Price Action and Trading Strategy

Bullish Scenario:

  • A confirmed breakout above $87k could push BTC toward the $90,000 – $91,000 resistance zone.
  • Traders may look for short-term long opportunities once BTC sustains above this level with strong volume support.

Bearish Scenario:

  • A breakdown below $85k may indicate a bearish continuation toward $82,000 – $83,000.
  • Short positions could be considered if BTC fails to regain strength above $85k after a breakdown.

Final Thoughts: Bitcoin Market Outlook

Bitcoin’s low volatility and tight range consolidation suggest an imminent breakout. The price action around $86,900 (resistance) and $85,200 (support) will determine BTC’s short-term direction. Traders should remain cautious and watch volume trends for confirmation before entering positions.

Happy
0 0 %
Sad
0 0 %
Excited
0 0 %
Sleepy
0 0 %
Angry
0 0 %
Surprise
0 0 %

Ethereum (ETH) Technical Analysis: 8 March 2025

0 0
Read Time:2 Minute, 12 Second

Ethereum (ETH) is currently in a consolidation phase, trading between the $2,050 – $2,320 range. The price has tested both support and resistance zones multiple times, indicating a potential breakout in either direction.

This technical analysis examines key support and resistance levels, potential price movements, and critical breakout zones to help traders make informed decisions.

Ethereum (ETH) Key Levels Analysis

Support Zone: $2,050 – $2,100

  • Ethereum has been holding strong within this support range.
  • Buyers have consistently entered near $2,050, preventing a further decline.
  • A breakdown below $2,000 could trigger a bearish continuation, leading to further price depreciation.

Immediate Resistance: $2,300 – $2,320

  • ETH faces selling pressure in this range.
  • If ETH successfully breaks and sustains above $2,320, an upward movement toward higher resistance levels is likely.
  • The next target after breaking $2,320 is $2,530 – $2,550, where strong resistance is expected.

Major Resistance: $2,530 – $2,550

  • This level represents a strong supply zone, where ETH has previously faced rejection.
  • A successful breakout above $2,550 could confirm a shift in momentum toward higher targets.

Key Upside Level: $2,820 – $2,840

  • If ETH breaks $2,550 and maintains momentum, it could rally toward $2,820 – $2,840, marking a major technical breakout.
  • This level will act as a key psychological and technical resistance.

Downside Risk: Below $2,000

  • If ETH fails to sustain $2,000 – $2,020, the price could decline further.
  • A breakdown below $2,000 may lead to a drop toward $1,930 – $1,950, indicating a shift in market sentiment.

ETH Price Action and Market Outlook

Ethereum’s price action is currently at a critical inflection point. A break above $2,320 could confirm upward momentum, pushing ETH toward the $2,550 resistance zone. Conversely, failure to hold $2,000 could indicate a deeper correction toward $1,930 – $1,950.

Trading Strategies Based on Technical Analysis:

Upward Strategy:

  • Look for a confirmed breakout above $2,320, targeting $2,530 – $2,550.
  • If ETH holds above $2,550, consider long positions with a target of $2,820 – $2,840.

Downward Strategy:

  • A breakdown below $2,000 could signal a shorting opportunity toward $1,930 – $1,950.
  • Traders should monitor volume and momentum indicators for confirmation.

Final Thoughts: Ethereum Price Prediction

Ethereum’s price movement remains in a consolidation phase, but key support and resistance zones indicate a potential breakout. Traders should closely watch the $2,320 resistance and $2,000 support levels for directional bias.

A breakout above $2,550 could open doors for further price movement, while a breakdown below $2,000 may result in a further decline.

Happy
0 0 %
Sad
0 0 %
Excited
0 0 %
Sleepy
0 0 %
Angry
0 0 %
Surprise
0 0 %
Exit mobile version