Meme coins have surged in the past week, with the charts glowing green. Greener pastures or just another pump-and-dump?
Memecoins are back in the spotlight as traders shift significant capital into the highly volatile and speculative market. As older memecoins like Dogecoin and Shiba Inu hold strong, new contenders have rallied with notable gains.
Fartcoin and Trump are examples of newer memecoins with notable market caps and gains in the past week. According to CoinMarketCap data, the charts reveal even capital inflow into the memecoins, suggesting a new cycle after weeks of volatility.
Should you consider memecoins?
Whether new or old and established memecoins, community hype could impact a coin’s behaviour. With a bullish community sentiment, the memecoin market could be poised for a rally in the mid-term, raking in profits for traders with a high risk appetite.
In such a case, now could be a good time to consider memecoins such as DOGE, FLOKI, and SHIB for accumulation. However, one should do their own research and understand that memecoins are highly volatile and risky due to their speculative nature.
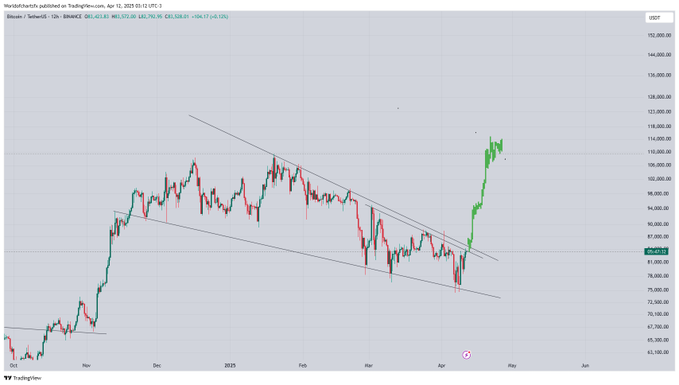
Bitcoin is recovering and currently testing the $83k-84k resistance zone. With the trade war cooling, is BTC’s rally on the cards?
Bitcoin has surged 2.07% in the past 24 hours signalling a strengthening bullish momentum. According to CoinMarketCap data, BTC was trading at $83,810 at the time of writing.
Following a freeze on trade tarrifs by U.S President Donald Trump, the stock market has been recovering. Similarly, Bitcoin bulls are pushing upwards as BTC tests the $83k-84k key resistance zone on the 12-hour chart.
Source: X
Based of Technical analysis by World of Charts on X( formerly Twitter), if Bitcoin bulls break past the $84k above this key resistance zone, the King of crypto could be poised for a notable uptrend.
Bitcoin’s RSI stands at 51, a neutral zone showing more buying potential. With more than 313 million in Exchange outflow, and 88% of holders in profit, the happy “strong hands” could be accumulating more. While new traders enter new positions, a breakout could lead to the next bull rally.
Avalanche has surged nearly 10% with notable trading volume as open interest rises.
AVAX has surged in trading volume following VanEck’s strategic move to file for Avalanche’s Spot ETFs. Avalanche was trading at $19.21, a 10% price surge in the past 24 hours and a 25% surge in the last 2 days, at press time. According to Coinglass data, the coin has seen its open interest rise 13% in the past 24 hours, suggesting a strong bullish momentum.
Why AVAX could sustain its strength in the mid-term
Source: X
Avalanche has formed a double bottom pattern on the 12-hour chart. According to analyst TedPillows on X, a close above $23 could spark a bullish rally in the mid-term.
Looking at Avalanche’s technical indicators, short-term and long-term moving averages and MACD(12,26) flash a strong “buy”.The altcoin’s Relative Strength Index (RSI) stands at 51. This indicates that AVAX is not overbought and has potential for more buying, as of this writing. With Avalanche Spot ETFs filed, the coin could be poised for long-term gains as investor conviction rises.
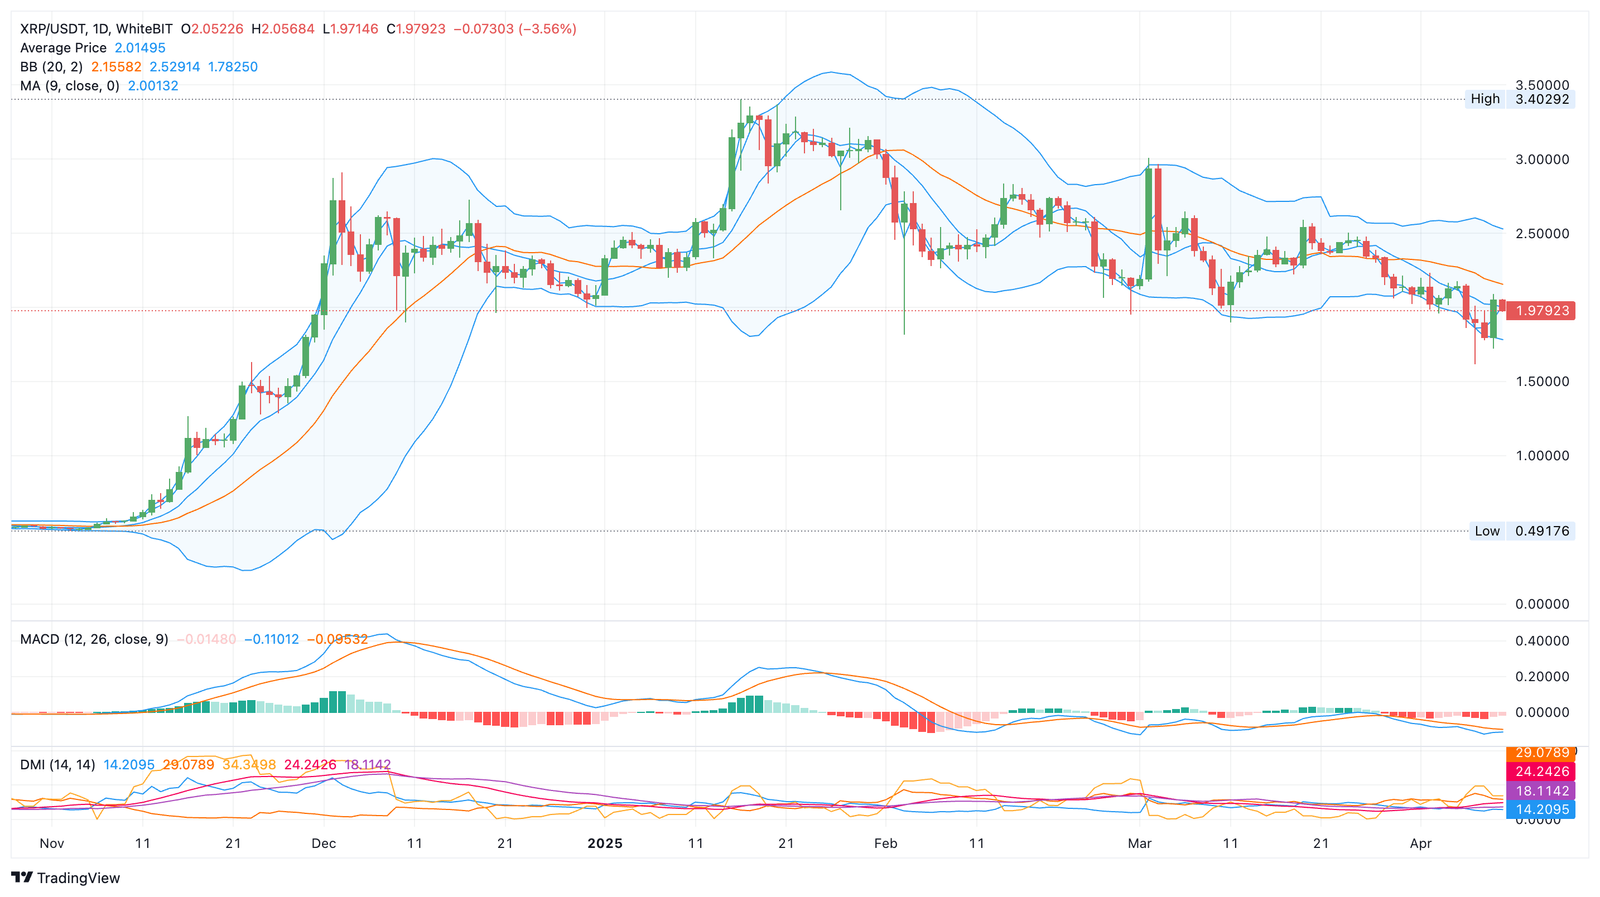
XRP has hit $2 following a 14% surge as the crypto market rebounds from the trenches.
Following a week of turmoil in the global economies and over $1 billion in crypto liquidations, the market could be poised for stabilization. Many altcoins are seeing a rebound from the market dip, with XRP rallying 14% in the last 24 hours. Per CoinMarketCap, XRP was trading at $1.99 at press time.
XRP could be eyeing $2.5 in the mid-term
Looking at XRP’s technical setup, the coin’s MACD is on the verge of a bullish crossover. This could be a potential confirmation signal of XRP’s uptrend rally as it secures a daily close above $2. According to CryptoAndy, on CoinMarketCap, capital inflow into the market could see XRP target $2.5 next after breaking above this level.
Source: CoinMarketCap
As the market recovers from the trade war, traders entering new positions could strengthen XRP’s bullish momentum. With open interest rising, one should keep an eye on the altcoin’s next moves at this level.
A bounce-off above the $0.13 support level could see DOGE begin its uptrend momentum, while a breakdown could lead to further downside.
Dogecoin has been trading above a rising trend line on the weekly chart and fully respecting it since Q4, 2023. As of press time, DOGE was trading at $0.1424, a 5.8% dip in the last 24 hours, per CoinMarketCap. According to renowned crypto analyst, Ali Martnez on X (formerly Twitter), the $0.13 key resistance level on Dogecoin’s support line is a key psychological level.
Source: X
Why does the $0.13 zone matter?
At this level, the 61.8% Fibonacci retracement converges with Dogecoin’s support, making $0.13 both a technical and psychological battleground. As the crypto market fluctuates in panic, the meme-coin’s next direction could be defined in this zone.
One should keep an eye on this level, as Dogecoin’s average direction index remains neutral in the short term. Additionally, following smart money and whale activity in this zone could give further insights.
Fartcoin has surged 20% in trading volume as open interest rises.
Fartcoin has faced renewed interest in the market as major cryptocurrencies face high price volatility. Over the last 24 hours, the meme-coin has surged 24% in price and was trading at $0.5722, at press time, per CoinMarketCap. On-chain metrics signal organic price growth based on low whale activity or price manipulation. The Solana meme-coin is showing strength as Wall Street bleeds more.
Open Interest (OI) Funding Rate turns positive
Looking at the current market sentiment, traders have unexpectedly shifted into buying this memecoin promising short-term gains. According to Coinglass, the OI-Funding Rate has turned positive in the past 48 hours, signalling trader optimism in Fartcoin’s bullish momentum.
Source: Coinglass
Looking at the technical indicators, Fartcoin’s moving averages flash a “strong buy” showing substantial buying pressure. With the Relative Strength Index (RSI) at 59, the memecoin is not yet overbought. This indicates more buying potential. However, one should be aware of the volatility in the meme-coin markets before making any moves.
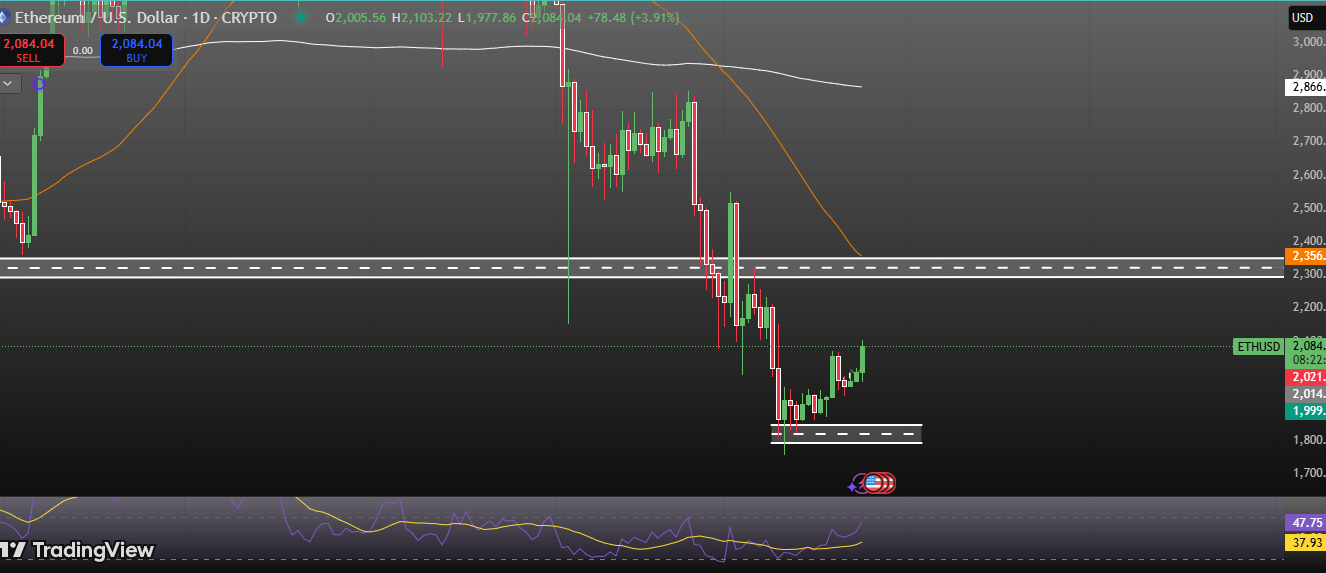
Ethereum (ETH) is currently trading at around $2078, showing a positive shift in market sentiment. However, despite recent upward movement, Ethereum is still facing resistance at key levels, and the overall market remains under pressure as it trades below its 50-day and 200-day moving averages.
The Relative Strength Index (RSI) is at 47, indicating that Ethereum may be nearing oversold conditions, suggesting that the price could be poised for a potential reversal in the coming days.
Key Resistance Levels
Ethereum is encountering immediate resistance at the $2100 level. A successful breakout above this price point will likely open the path for further upside movement toward the next resistance zone between $2150 and $2160. If ETH manages to surpass this critical resistance zone, the price could potentially rise toward the next significant target of $2300, signaling a potential shift into a neutral trend.
Immediate Resistance: $2100
Next Resistance Zone: $2150-$2160
Near-Term Target: $2300
Key Support Levels
On the downside, Ethereum has immediate support within the $1950-$2000 range. The $2000 level, in particular, is a crucial psychological barrier. If the price falls below this support zone, it could signal a shift back into a bearish market structure, potentially leading to further downside movement. Therefore, maintaining support above $2000 is critical for Ethereum to continue its neutral outlook.
Immediate Support: $1950-$2000
Psychological Level: $2000
Market Structure and Price Action
Ethereum has demonstrated resilience by maintaining support in the range of $1850-$1900. This strong support zone has encouraged buyers to step in, leading to a potential move upside. Ethereum’s price action recently surpassed the previous week’s high, signaling that a change in market structure may be underway.
Key Observation: Ethereum is breaking the previous week’s high.
Bullish Outlook: A daily close above $2100 will likely confirm a shift from a bearish to a Neutral market structure.
Technical Indicators
50-Day and 200-Day Moving Averages: Ethereum is still trading below both its 50-day and 200-day moving averages, which indicates that the market remains in a neutral or bearish trend. A breakout above these key moving averages would be a significant signal of change in momentum.
RSI (Relative Strength Index): The RSI currently stands at 47, suggesting that Ethereum is nearing oversold conditions. The RSI being below 50 indicates the price is still within a neutral zone, but the indicator’s approach to oversold levels may signal an imminent price reversal. Typically, an RSI below 30 signals oversold conditions, and the price could see an upward move if buying pressure intensifies.
RSI Level: 47 (Approaching oversold territory)
50-Day and 200-Day Moving Averages: Currently below, signaling neutral to bearish trend
Key Levels to Watch
Resistance at $2100: A decisive close above this level will signal the start of an upmove breakout, likely driving the price towards $2150-$2300.
Resistance Zone at $2150-$2160: Ethereum’s ability to break and hold above this range will be crucial for further upside momentum.
Support at $2000: The $2000 level is a major psychological and technical support level. If the price falls below this level, the bearish trend may resume.
Conclusion:
Ethereum’s technical outlook shows increasing strength, with strong support at $1850-$1900 and a potential breakout above $2100. Despite trading below the 50-day and 200-day moving averages, Ethereum’s price action suggests a short-term market structure change could be underway.
The RSI at 47 indicates that Ethereum is approaching oversold territory, which could signal a potential oversold if the buying pressure continues to build. A successful close above $2100 and sustained price action above the $2000 support level will likely confirm the shift into a Neutral with potential targets at $2150-$2300 in the near term.
Funding rates in margin trading significantly impact leveraged positions, yet many traders underestimate their importance. Whether trading Bitcoin, Ethereum, or other cryptocurrencies, knowing how these rates work can help traders optimize their strategies. This guide explores the function of funding rates, their impact on trading, and how to manage associated risks effectively.
Understanding Funding Rates in Margin Trading
Funding rates are a crucial component of perpetual futures trading, designed to maintain the contract price in alignment with the spot market. These rates act as an incentive mechanism, ensuring that long and short positions remain balanced, preventing extreme price deviations. Traders must account for these rates when planning their leveraged trades, as fluctuations can significantly impact profitability. Their purpose is to keep contract prices aligned with spot market prices. Depending on market trends, traders either pay or receive these fees, which directly affect their trading expenses.
How Funding Rates Operate
Funding rates fluctuate based on the difference between a perpetual contract’s price and the actual market price.
When the contract price surpasses the spot price, long traders compensate short traders through funding fees.
If the contract price falls below the spot price, short traders pay fees to long traders.
These adjustments help stabilize market conditions and prevent price manipulation.
The Significance of Funding Rates
1. Influence on Trading Costs
Funding rates can significantly impact overall trading expenses. Higher rates mean increased costs for holding leveraged positions, reducing net profits.
2. Market Sentiment Indicator
Positive funding rates indicate a bullish market, where demand for long positions is high.
Negative rates suggest bearish sentiment, with traders favoring short positions.
3. Strategic Adjustments
Experienced traders monitor funding rates to refine their trading decisions, optimizing entry and exit points based on market conditions.
4. Market Stability
By maintaining a balance between buyers and sellers, funding rates help prevent sudden price surges or crashes caused by artificial trading pressure.
Limit Leverage Usage: Lower leverage reduces exposure to funding costs and unexpected price swings.
Plan Entry and Exit Wisely: Timing trades before funding rate settlements can optimize profit potential.
Diversify Trading Portfolio: Spreading risk across different assets mitigates the financial impact of fluctuating rates.
Conclusion
Funding rates are a critical factor in margin trading, directly affecting trading costs and market stability. By understanding how they work and adopting sound risk management techniques, traders can make informed decisions and enhance their long-term success. Stay vigilant and adjust your strategies accordingly to thrive in the ever-evolving crypto market.
Leverage in crypto trading can be a powerful tool for maximizing profits, but it also comes with significant risks. Many traders are drawn to high leverage for its potential to amplify gains, yet they often overlook the increased chances of liquidation. So, how much leverage is too much? This article explores the pros and cons of leverage, strategies for managing risk, and how to find the right balance for your trading style.
What is Leverage in Crypto Trading?
Leverage allows traders to borrow funds to increase their trading position beyond what their capital would normally allow. For example, using 10x leverage means you can control a position worth $10,000 with only $1,000 of your own money. While this magnifies potential profits, it also means even a small price movement against your position can lead to liquidation.
The Pros and Cons of Leverage
Pros:
Amplified Profits: With a small initial investment, traders can potentially earn larger returns.
Increased Market Exposure: Leverage allows traders to take larger positions than their capital would permit.
Capital Efficiency: Traders can use leverage to make their capital work more efficiently.
Cons:
Higher Risk of Liquidation: If the market moves against a highly leveraged trade, liquidation happens quickly.
Emotional Trading: The pressure of managing leveraged positions can lead to impulsive decisions.
Increased Costs: Higher leverage often comes with increased trading fees and interest on borrowed funds.
How Much Leverage is Too Much?
The right leverage depends on your experience level, risk tolerance, and trading strategy.
Beginners: It is advisable to use low leverage (e.g., 2x-5x) or avoid leverage entirely until gaining sufficient experience.
Experienced Traders: Moderate leverage (5x-10x) can be used with strict risk management.
High-Risk Traders: Some advanced traders use extreme leverage (20x-100x), but this is highly speculative and not recommended for most.
Risk Management Strategies for Leveraged Trading
To use leverage safely, traders must implement proper risk management strategies:
Set Stop-Loss Orders: This prevents excessive losses by automatically closing trades at a predetermined price.
Use Position Sizing: Never risk more than a small percentage (e.g., 1-2%) of your total capital on a single trade.
Monitor Market Conditions: Stay updated on trends, news, and volatility before entering leveraged trades.
Avoid Overleveraging: Even if a platform offers high leverage, it doesn’t mean you should use it.
Diversify Your Portfolio: Don’t put all your capital into a single high-leverage trade.
Final Thoughts
Leverage can be a double-edged sword in crypto trading. While it offers opportunities for amplified gains, it also introduces significant risks. Understanding how much leverage is too much depends on your trading style, experience, and ability to manage risk. By using a disciplined approach and avoiding excessive leverage, traders can enhance their chances of long-term success in the volatile crypto market.
Solana (SOL) is currently trading at approximately $125, consolidating within the $120-$130 range on the daily time frame. This zone is acting as a crucial support level, and any breakdown below this range may trigger a further decline toward $110-$112.
Conversely, if buyers step in and push the price higher, the immediate resistance lies between $132-$137. A successful breakout above this level could lead to $148-$152.
Despite the recent pullback, buyers have shown weak momentum, as the price has repeatedly failed to sustain higher levels on larger time frames. SOL remains below the 200-day moving average, reinforcing the bearish sentiment and indicating that the broader market trend is still downward.
Key Technical Levels:
Immediate Support:$120-$130 – A key range where the price is consolidating. A breakdown below this level could accelerate selling pressure.
Major Support Zone:$110-$112 – If the $120-$130 range fails to hold, the next significant support lies at $110-$112, where buyers may attempt to regain control.
Immediate Resistance:$132-$137 – A breakout above this level could trigger a short-term bullish move.
Next Resistance Zone:$148-$152 – If SOL clears the $132-$137 resistance, this area will be the next upside target.
Bearish Confirmation Level:Below $110 – If the price breaks below $110, the downtrend could extend significantly, possibly targeting lower support levels around $80-$85.
Technical Indicators & Market Sentiment:
Moving Averages:
200-Day Moving Average: SOL is trading below the 200-day MA, a strong bearish indicator suggesting the price is in a long-term downtrend.
30-Day MA & 9-Day EMA: Shorter moving averages indicate that price action is still struggling to establish a sustainable upward move.
Volume Analysis:
Trading volume remains relatively low, suggesting a lack of strong buying interest.
If the price approaches key resistance levels with high volume, it may indicate potential bullish momentum.
Trend Analysis:
Solana remains in a bearish structure, consistently forming lower highs and lower lows.
The price needs to break above the 200-day moving average and establish higher highs to confirm a trend reversal.
Market Outlook & Conclusion:
Solana’s price action suggests that the market is still in a bearish phase, as evidenced by its failure to sustain higher levels and continued trading below the 200-day moving average.
The $120-$130 support zone remains a key level to watch—if it holds, SOL may attempt an upside move toward $132-$137 and possibly $148-$152. However, failure to hold this support could result in a deeper decline to $110-$112, with a more bearish scenario targeting $80-$85.
Given the overall downtrend, traders should exercise caution and wait for a clear breakout above $170-$180 or a confirmed bullish structure before considering long positions. Until then, SOL remains bearish territory, and short-term rallies should be viewed as potential selling opportunities rather than trend reversals.
Disclaimer: This analysis is for educational purposes only and should not be considered financial advice.