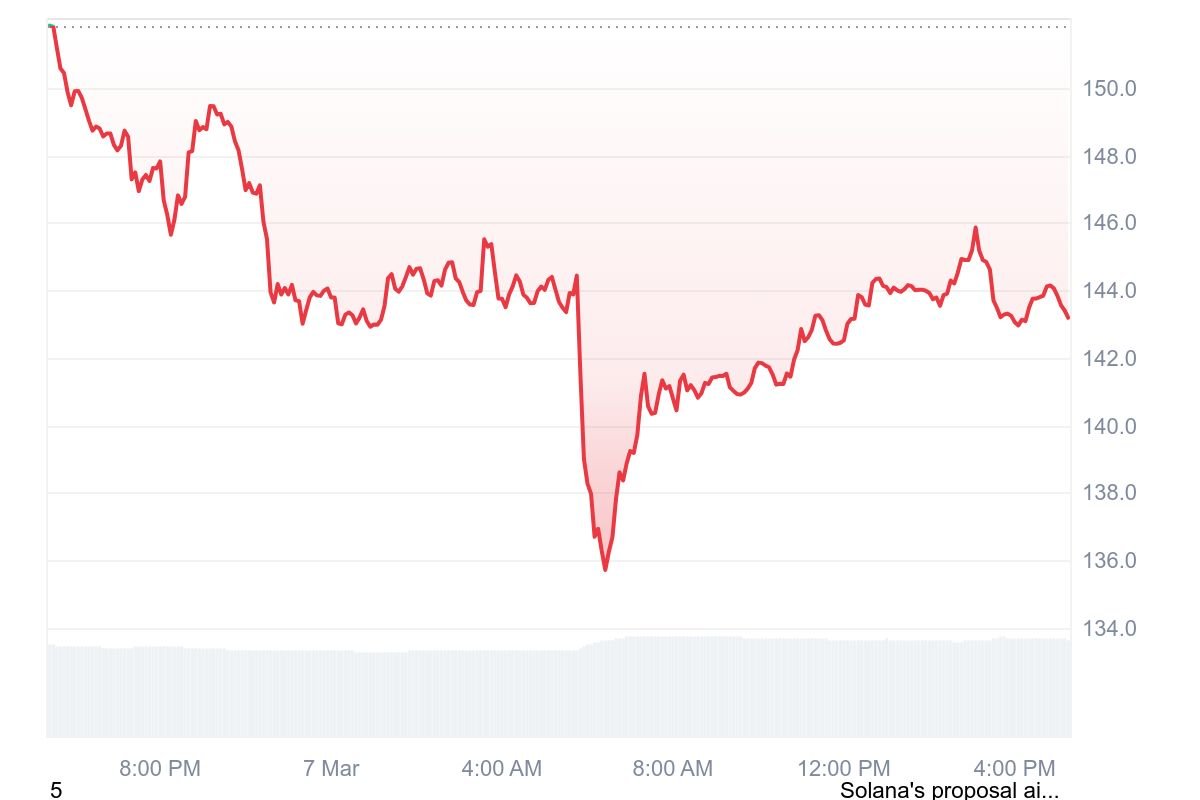
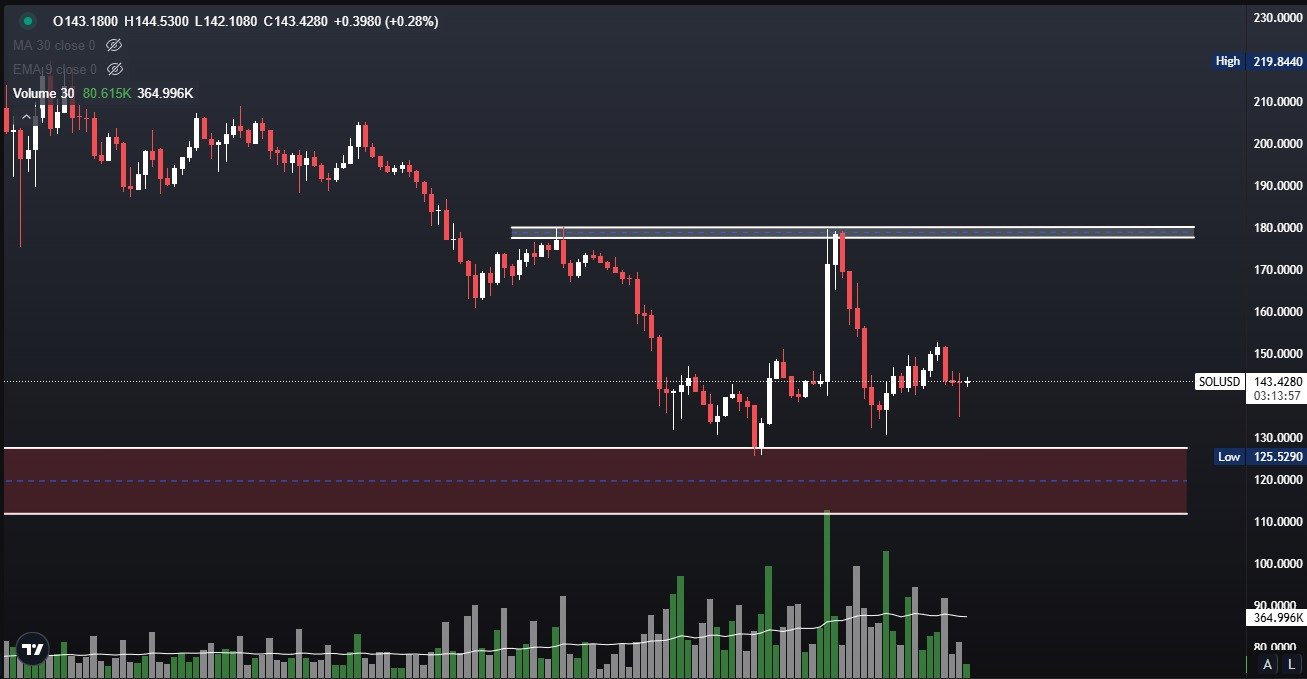
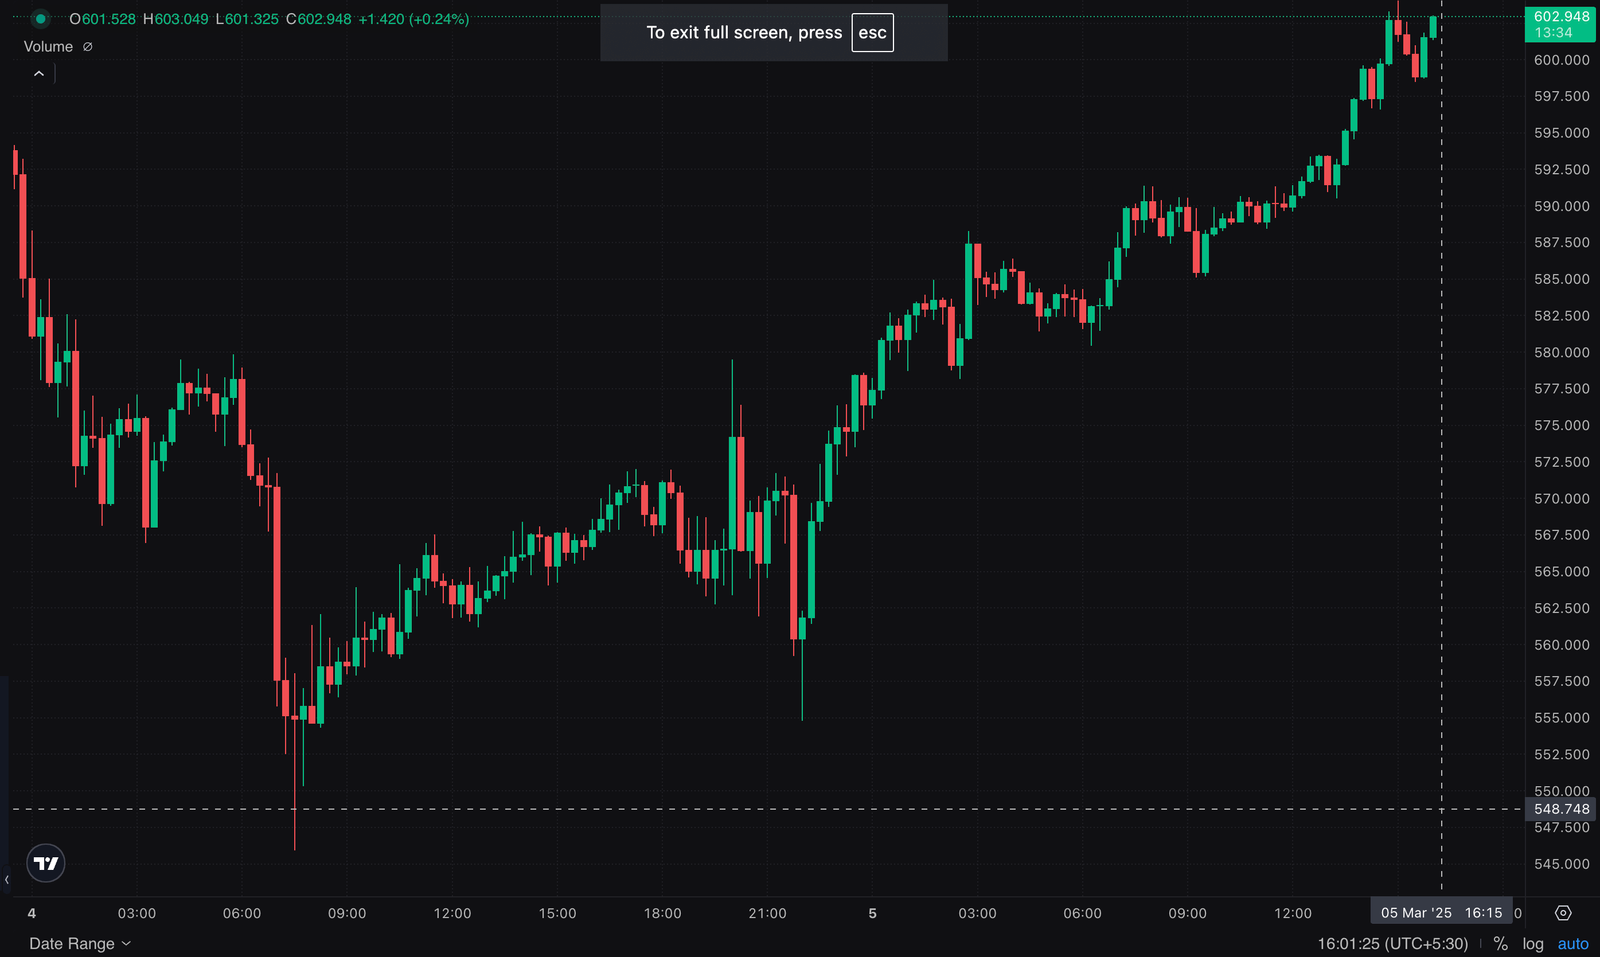
SOL continues to trade within a consolidation range, with buyers and sellers battling at critical support and resistance levels. The chart indicates that price action is approaching key decision points that will likely determine the next significant move.
Currently, SOL is struggling to break above the $150 – $155 resistance range, indicating strong selling pressure at these levels. If the price manages to break and sustain above $155, it could trigger a wave of bullish momentum, leading to an initial target of $178 – $180. A further breakout above $180 would likely induce short covering, potentially pushing SOL toward $188 – $190.
On the downside, the $130 – $135 demand zone is crucial for preventing further declines. A failure to hold this support could expose SOL to deeper losses, with the next major support resting at $120. If SOL breaches this level, bearish sentiment may strengthen, leading to an extended downtrend.
Volume & Momentum:
The volume indicator shows increased activity near support and resistance zones, suggesting active participation from both bulls and bears. The recent rejection near $155 aligns with strong historical resistance, while the demand zone around $130 is a key area to monitor for buyer re-entry.
Solana Technical Analysis: Conclusion
SOL remains at a pivotal point, with $155 acting as the key resistance and $130 as the critical support. Traders should closely observe price action at these levels. A breakout above $155 could lead to further upside movement towards $180, while a breakdown below $130 might accelerate losses towards $120.
However, the price is still under bearish control, and long positions remain highly risky at this stage. It is advisable to wait for clear confirmation of a trend reversal before considering any long trades.
Stay cautious and adjust risk management strategies accordingly.
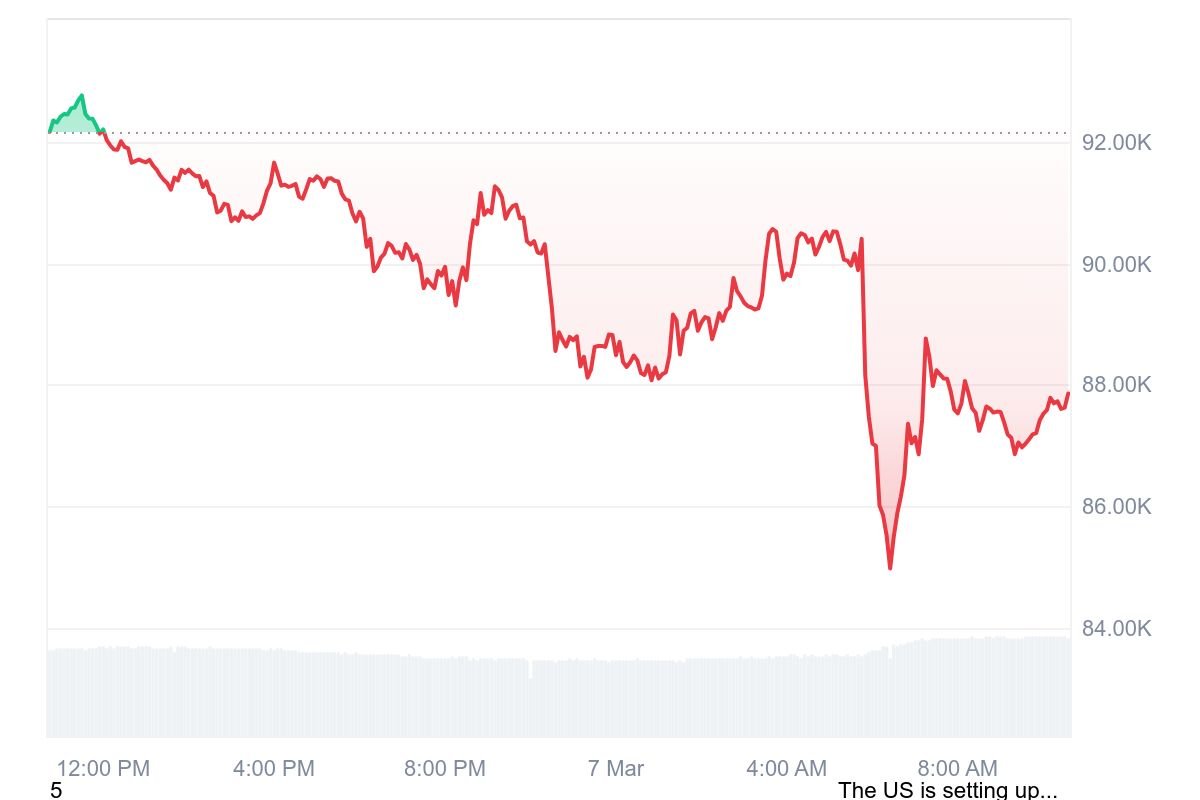
Bitcoin trading signal indicates that BTC remains under bearish pressure, with price action testing critical supply and demand zones that could determine the next major move. Traders should closely watch these levels for potential breakout or breakdown scenarios to make informed trading decisions.
Key Bitcoin Trading Levels:
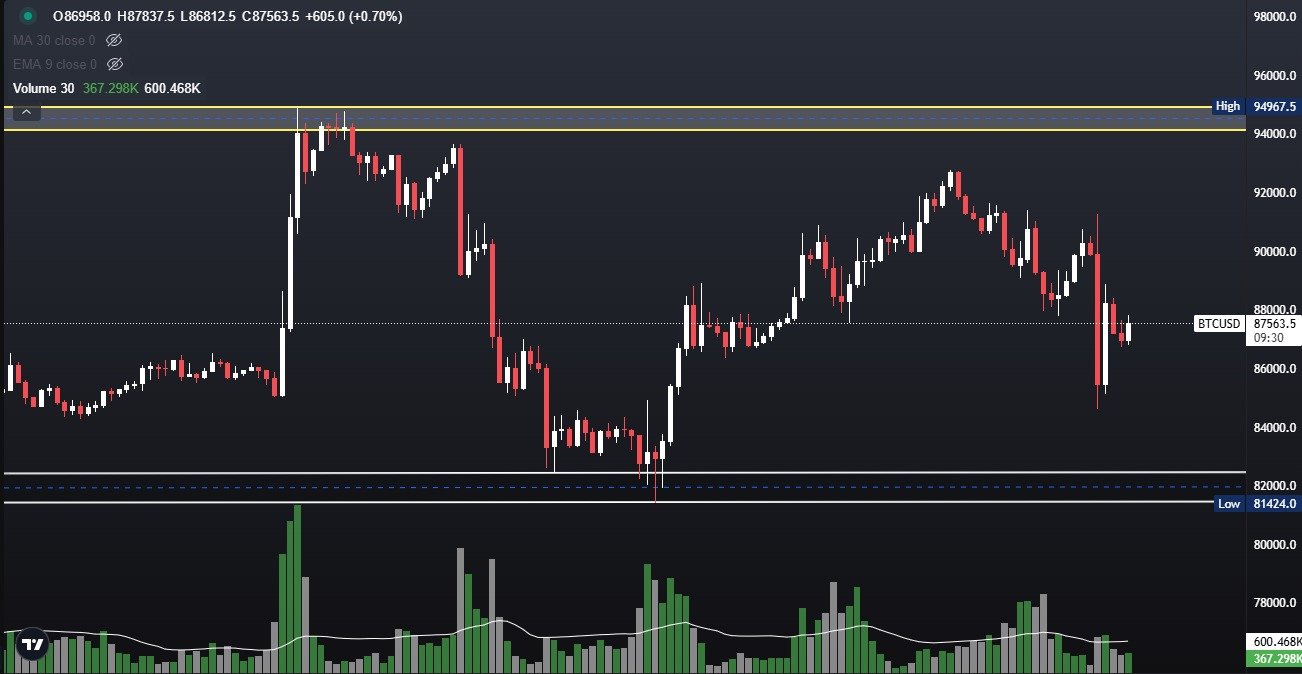
Supply Zone: $94,000 – $95,000
Demand Zone: $80,000 – $81,000
Upside Breakout Target: $100,000
Downside Breakdown Target: $72,000 – $73,000
Market Analysis:
Bitcoin is struggling near $87,563, failing to gain strong bullish momentum. The recent rejection at $94,967 highlights significant selling pressure.
A breakout above $95K, supported by strong volume, could fuel a short squeeze, pushing BTC toward the $100K psychological level.
A break below $80K and failure to hold $81,424 could trigger further downside, potentially leading BTC into the $72K – $73K demand zone.
Volume & Momentum Insights:
Volume analysis shows heightened activity from both institutional and retail traders, but the lack of sustained buying pressure suggests that sellers remain dominant.
Conclusion – Bitcoin Trading Signal Strategy:
BTC sits at a critical decision point, with $95K acting as a key resistance and $80K as a crucial support level.
A breakout above $95K may trigger a rally to $100K, while a breakdown below $80K could lead to further downside pressure.
Trading Strategy Recommendation:
Traders should closely monitor these critical levels, watch for volume confirmation, and adjust risk management strategies accordingly to capitalize on Bitcoin’s next major move.
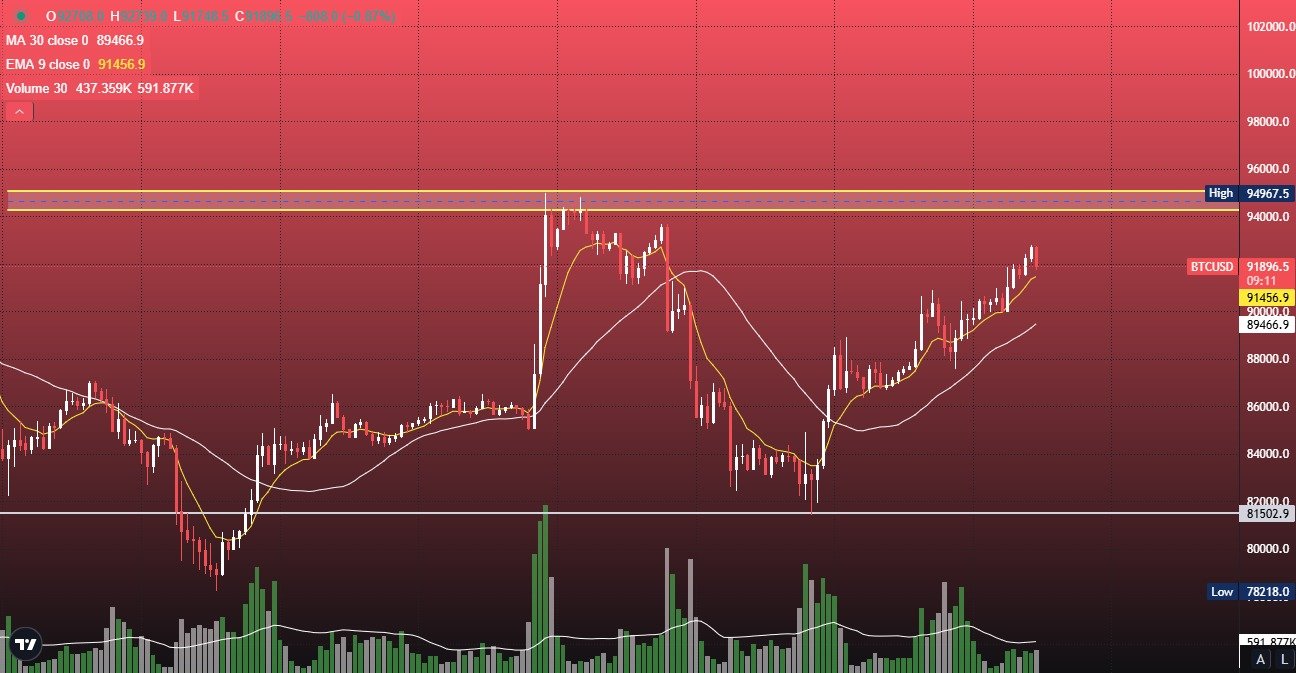
Bitcoin (BTC/USD) is showing signs of structural change, transitioning from lower lows to higher highs, indicating that momentum is shifting. The price has successfully held key support levels and is now testing a critical resistance zone at $94,000-$95,000.
A breakout above this level could fuel a rally toward $100,000, while a failure could trigger a pullback. Let’s analyze the key levels that will determine Bitcoin’s next move.
Bitcoin Trading Signal: Key Resistance and Support Zones
Bitcoin is currently testing the *$94,000-$95,000 resistance range, which has previously acted as a supply zone. If BTC successfully *breaks and sustains above this level, it could confirm further bullish momentum.
• A breakout above $95,000 with strong volume could push BTC toward the psychological level of $100,000.
• Traders should look for increasing volume and strong candle closes above this resistance for confirmation of a breakout.
Major Resistance: $100,000 (Psychological Barrier)
If BTC clears *$95,000, the next key resistance stands at $100,000, which is a *major psychological level and a likely target for profit-taking.
• A confirmed breakout above $100,000 would likely lead to its all-time high.
• Expect some volatility and possible retracements around this area before further continuation.
Immediate Support: $86,000 (Short-Term Level to Watch)
On the downside, $86,000 remains an important short-term support level. The market has previously respected this area, making it a crucial pivot point.
• If BTC remains above $86,000, it indicates accumulation and potential for another leg higher.
• A breakdown below $86,000 could trigger a pullback toward deeper support zones.
Major Support: $78,000 (Key Downside Level)
The previous higher low structure suggests that $78,000 is the most critical level to hold for bulls. This zone represents strong demand and has held as a significant reversal point in the past.
• If BTC breaks below $78,000, expect further downside movement toward the $72,000-$73,000 region.
• A decline to $72,000-$73,000 would confirm a deeper correction and a potential trend reversal.
Bitcoin Trading Signal: Conclusion & Strategy
Bitcoin is currently *testing a key resistance zone at $94,000-$95,000, and its ability to break above this level will determine its next move. *Holding above $89,000 keeps the uptrend intact, while a break below $78,000 could lead to a further drop.
Bullish Scenario: If BTC breaks and sustains above $95,000, it could rally toward $100,000. Bearish Scenario: A break below $78,000 could see BTC drop to $72,000-$73,000.
Traders should closely monitor volume confirmations and key support-resistance interactions to navigate BTC’s next major move. 🚀
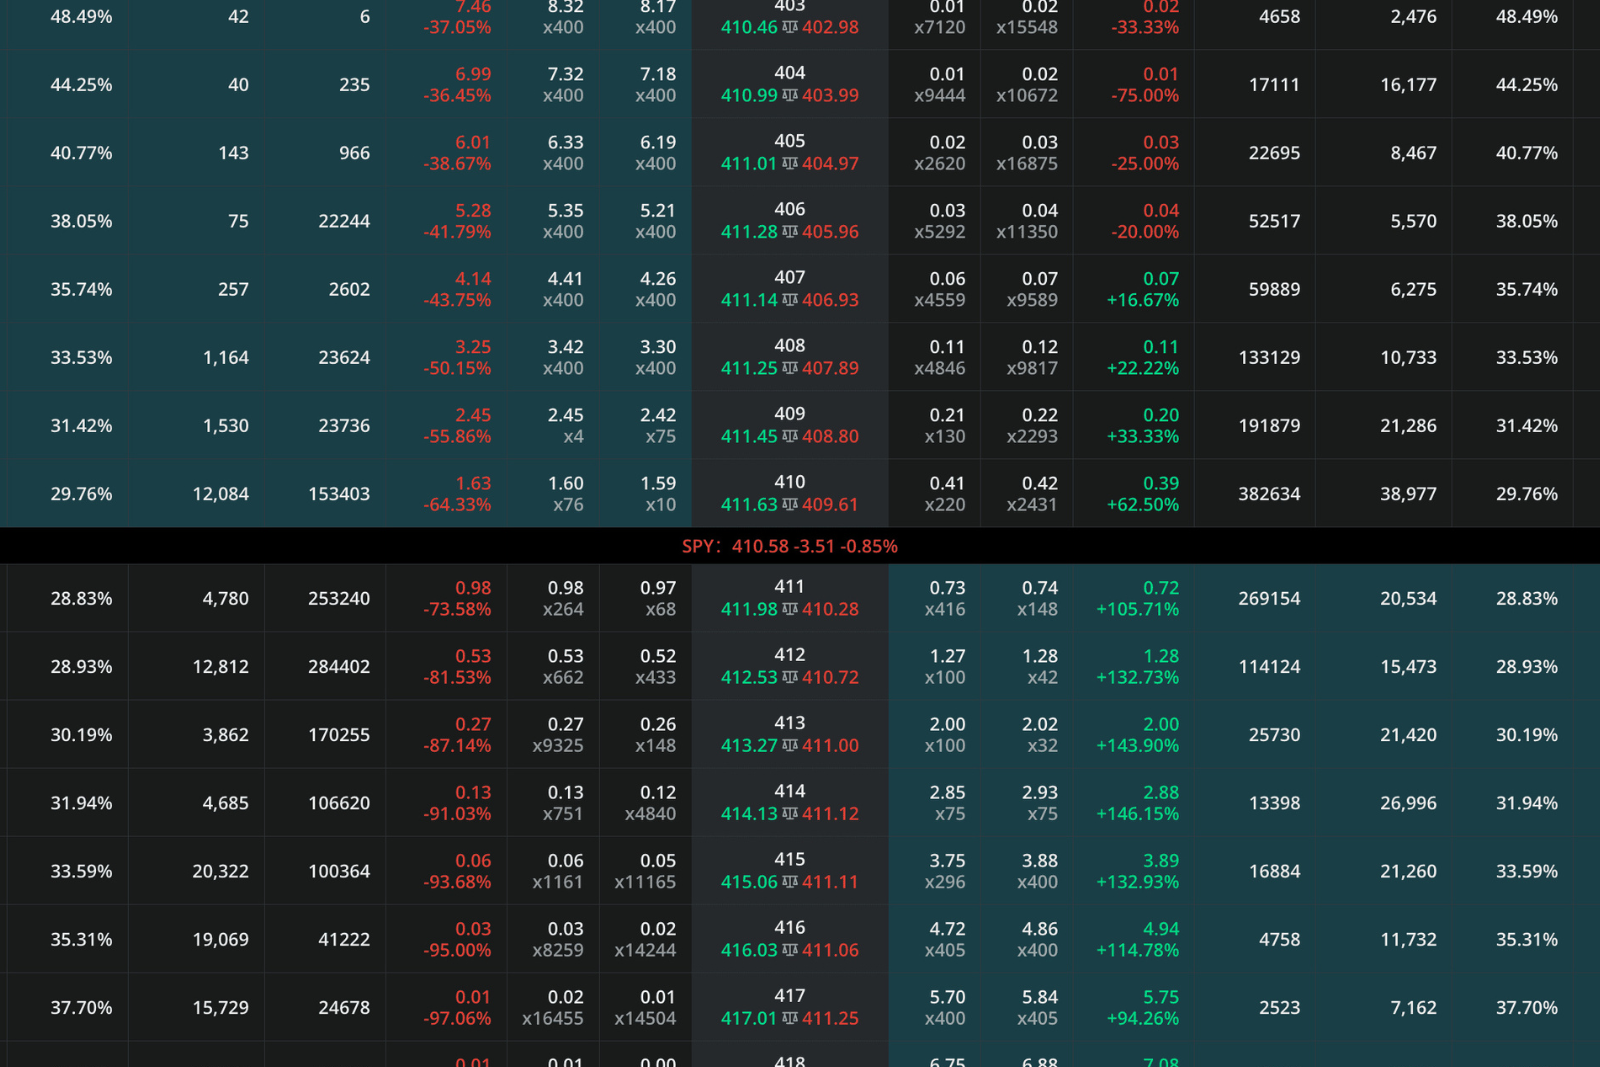
Option chain analysis is a powerful tool that helps traders identify profitable opportunities in the market. Whether you are a beginner or an experienced trader, understanding option chains can give you a strategic edge. In this guide, we’ll break down everything you need to know about option chain analysis, including how to interpret data, key indicators, and actionable strategies to spot winning trades instantly.
What is an Option Chain?
An option chain is a detailed listing of all available option contracts for a particular stock or index. It provides crucial data such as strike prices, bid-ask prices, open interest, and implied volatility, which traders use to make informed decisions.
Key Components of an Option Chain
Strike Price: The predetermined price at which an option contract can be exercised, either to buy (for a call option) or sell (for a put option) the underlying asset.
Expiration Date: The last date on which the option can be exercised.
Bid and Ask Price: The highest price a buyer is willing to pay (bid) and the lowest price a seller is willing to accept (ask).
Open Interest (OI): The total number of outstanding option contracts.
Implied Volatility (IV): The market’s expectations for future volatility.
Volume: The total number of contracts traded during the trading session.
How to Analyze an Option Chain for Winning Trades
1. Identify High Open Interest (OI)
High OI indicates strong interest in a particular strike price, suggesting potential liquidity and price movement. Look for strike prices with the highest OI as they are likely to be key levels of support and resistance.
2. Observe Changes in Open Interest
A sudden increase in OI suggests that new positions are being created, signaling a possible price move. If OI decreases, it could mean traders are closing positions, leading to reduced momentum.
3. Monitor Implied Volatility (IV)
Higher IV means the market expects significant price swings, which can increase option premiums. Low IV suggests stable conditions but may offer cheaper entry points.
4. Watch for Unusual Volume Activity
A sharp increase in volume compared to the average daily volume can indicate strong market sentiment and upcoming price action.
5. Identify the Put-Call Ratio (PCR)
The PCR is calculated by dividing the total put volume by the call volume. A ratio above 1 indicates bearish sentiment, while below 1 suggests bullish sentiment.
6. Analyze Bid-Ask Spread
A narrow bid-ask spread means higher liquidity and lower transaction costs. Avoid options with a wide spread, as they are less liquid and harder to trade profitably.
Actionable Strategies to Use Option Chains Effectively
1. Trend Confirmation Strategy
Use the option chain to confirm existing trends. If call options have higher OI and increasing volume at key resistance levels, it signals strong bullish sentiment. Conversely, rising put OI near support levels indicates bearish sentiment.
2. Reversal Trading Strategy
Identify extreme OI and volume concentrations at specific strike prices. If traders are aggressively buying puts but the stock shows resilience, it could indicate an upcoming reversal.
3. Breakout Strategy
Look for unusual spikes in volume and IV near key strike prices. This suggests an impending breakout, and traders can position themselves using call or put options accordingly.
4. Hedging Strategy
Investors holding stocks can use option chains to hedge against potential losses by purchasing protective puts when IV is low and OI is high.
Conclusion
Mastering option chain analysis can help you spot high-probability trades instantly. By understanding open interest, volume, implied volatility, and strike price activity, you can make more informed trading decisions. Whether you are trading for profits or hedging risks, a well-analyzed option chain can be your gateway to success in the options market.
Option buying is a dynamic and strategic approach to trading in the financial markets. It offers traders the potential for significant profits with a relatively low initial investment. However, the risks involved require a thorough understanding of market conditions, pricing mechanisms, and effective risk management strategies.
This article provides a comprehensive guide to option buying, covering its fundamentals, associated risks, and the best strategies to maximize success while minimizing potential losses.
Understanding Option Buying
Options are derivative contracts that give buyers the right, but not the obligation, to buy or sell an underlying asset at a predetermined price before a specified expiration date.
Call Options: Give the buyer the right, but not the obligation, to purchase an asset at a predetermined price before the option expires.
Put Options: Allow the holder to sell an asset at a fixed price within a specified timeframe, providing downside protection.
Option buyers pay a premium to enter these contracts, which allows them to participate in market movements with lower capital compared to directly buying the asset. However, due to time decay (Theta), the value of options diminishes as expiration approaches, making strategic selection crucial.
Key Risks Associated with Option Buying
While option buying offers immense potential, it also carries considerable risks. Here are the most critical risk factors:
1. Time Decay (Theta Risk)
Options lose value over time, especially if the underlying asset does not move in the anticipated direction. The closer an option gets to expiration, the faster its value declines.
2. Volatility Risk (Vega Impact)
Options thrive on volatility. A drop in implied volatility can reduce the option’s price, even if the asset moves as expected.
3. Liquidity Risk
Some options have low trading volumes, leading to wider bid-ask spreads, making it harder to enter or exit trades efficiently.
4. Directional Risk
If the price of the underlying asset moves unfavorably, the entire premium paid for the option can be lost.
5. Overpaying for Options
Many traders mistakenly buy overvalued options, leading to losses even when the market moves in their favor.
Proven Strategies for Option Buying Success
To maximize profits while minimizing risks, traders need a clear strategy. Below are some of the most effective approaches to navigate the options market successfully:
1. Trend-Following Strategy
Identify prevailing market trends using technical indicators like moving averages, RSI, and MACD.
Buy call options in an uptrend and put options in a downtrend.
Avoid counter-trend trading to minimize losses.
2. Momentum-Based Option Buying
Use Bollinger Bands and MACD to identify strong price momentum.
Enter positions when a breakout is confirmed.
Exit trades quickly to avoid excessive time decay.
3. Implied Volatility (IV) Analysis
Buy options when IV is low (cheaper premiums).
Avoid buying when IV is high, as option prices may collapse once volatility drops.
4. Event-Driven Option Trading
Trade around earnings reports, economic releases, or policy changes.
Select near-the-money (ATM) options with adequate time to expiration.
Exit post-event to capitalize on volatility spikes.
5. Hedging Strategy
Use protective puts or covered calls to reduce downside risks.
Employ spreads like bull call spreads or bear put spreads for controlled exposure.
Best Practices for Risk Management in Option Buying
Effective risk management is essential to long-term success in options trading. Follow these principles:
1. Position Sizing
Never risk more than 1-2% of your capital on a single trade to preserve funds for future opportunities.
2. Stop-Loss Orders
Establish stop-loss levels based on percentage declines in option value (e.g., exit if the option loses 50% of its premium).
3. Diversification
Avoid concentrating capital on a single options trade. Spread exposure across different assets or strategies.
OTM options may appear inexpensive but have lower probabilities of profitability. Prioritize At-the-Money (ATM) or In-the-Money (ITM) options for better risk-reward ratios.
5. Choosing the Right Expiry Date
Short-term traders should opt for weekly or monthly expirations.
Long-term investors may prefer longer expirations (LEAPS) to counter time decay.
Conclusion
Option buying is a powerful strategy that provides traders with leveraged exposure to the financial markets. However, success requires a thorough understanding of time decay, volatility, liquidity, and position sizing. By adopting effective strategies and practicing strong risk management, traders can significantly improve their profitability.
By following this, both novice and experienced traders can navigate the complexities of option buying with greater confidence and precision.
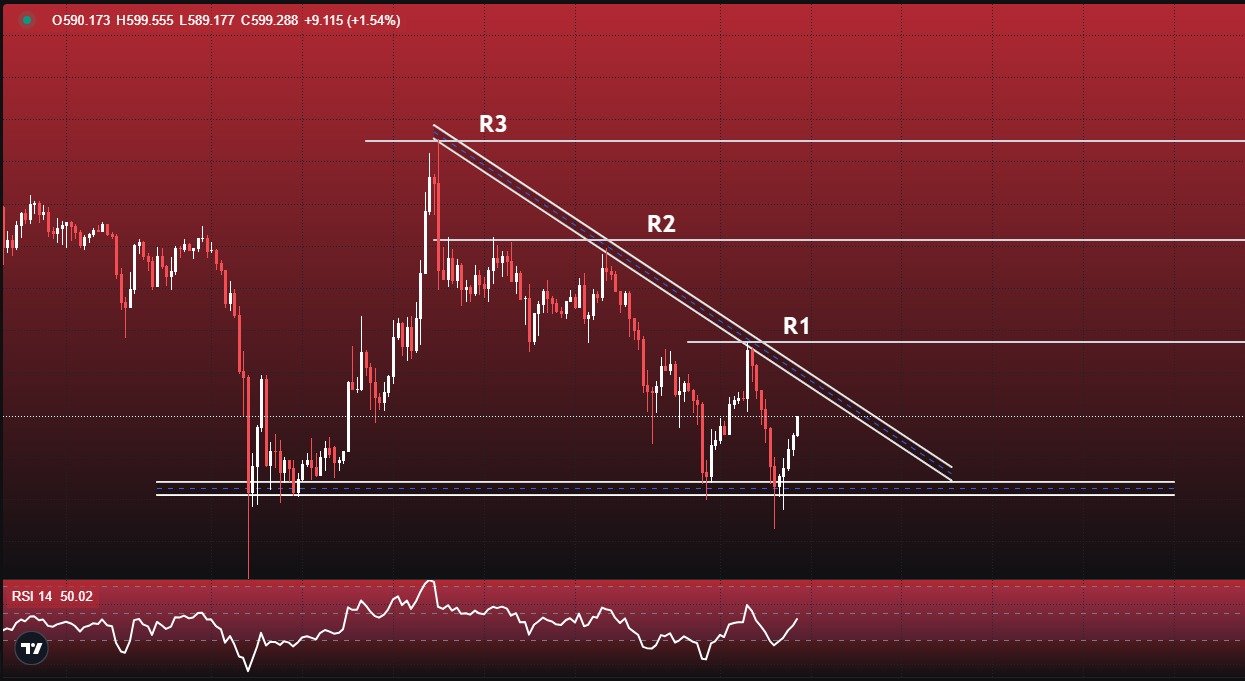
BNB is currently trading near a critical support zone of $560-$570, a decisive area that could determine its next major move. If the price drops below $542 and confirms a breakdown, we could see further declines toward $500-$490.
BNB Key Levels to Watch
🔹 Major Support Zone: $560-$570
🔹 Breakdown Level: Below $542 → Potential downside targets $500-$490
🔹 Immediate Resistance Levels:
R1: $635
R2: $675
R3: $730
If BNB breaks above R1 ($635) with strong volume and sustains the breakout, further upside movement toward R2 ($675) and R3 ($730) is likely.
Technical Indicators & Market Sentiment for BNB
1. Trendline & Price Action
🔸 BNB remains in a bearish structure, trading below a strong descending trendline.
🔸 Sellers control the market unless BNB breaks above this trendline resistance.
🔹 Current RSI: 50.02 (Neither overbought nor oversold – neutral sentiment).
🔹 If RSI rises above 60, it could indicate bullish momentum.
🔹 If RSI drops below 40, it may trigger increased selling pressure and a potential breakdown.
3. Volume Confirmation – Key for a Strong BNB Trading Signal
🔸 A breakout above resistance requires strong volume confirmation.
🔸 If BNB falls below $542 with high volume, it could confirm a bearish continuation.
BNB Market Outlook: What’s Next?
Bearish Scenario
🔻 If BNB closes below $542, expect a drop to $500-$490.
🔻 The downtrend remains intact unless a breakout above key resistance levels occurs.
Bullish Scenario
✅ If BNB holds above $570 and breaks R1 ($635) with strong volume, a bullish push is possible.
✅ A breakout above R2 ($675) and R3 ($730) would confirm a trend reversal.
Conclusion: Trade with Caution & Watch for a Strong BNB Trading Signal
Currently, BNB leans bearish, with descending trendline resistance and key support levels in focus.
📉 Short traders: A confirmed break below $542 could offer shorting opportunities, targeting $500-$490.
📈 Bullish traders: A confirmed breakout above $635 with strong volume could signal a trend reversal.
⚠ Monitor price action, volume, and key technical levels to confirm the next BNB trading signal.
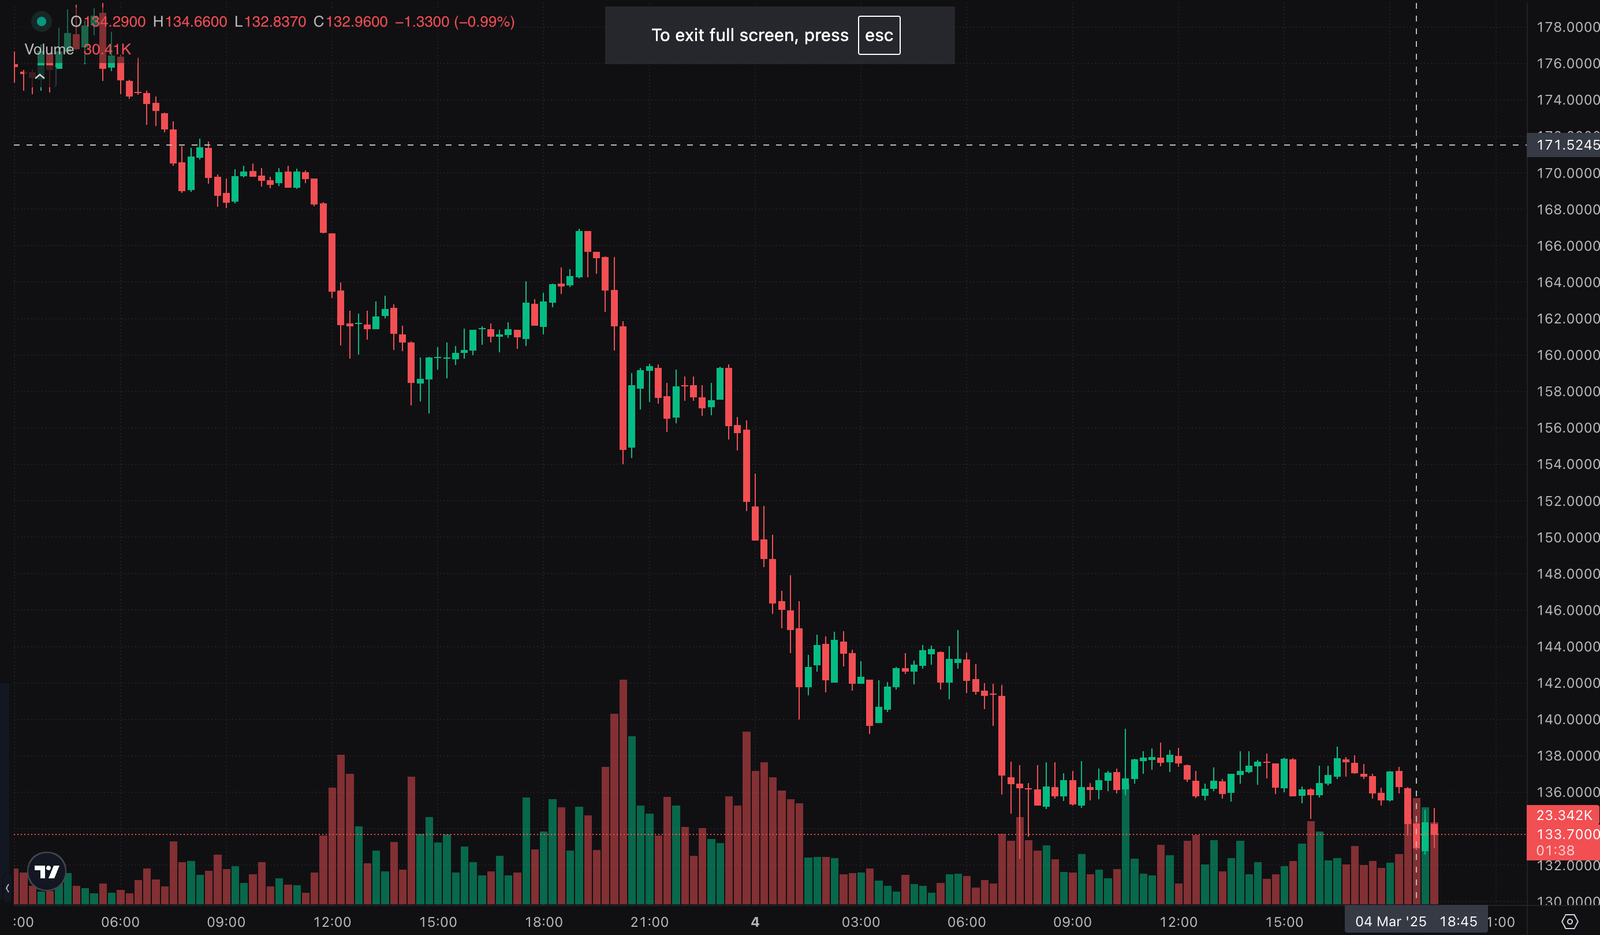
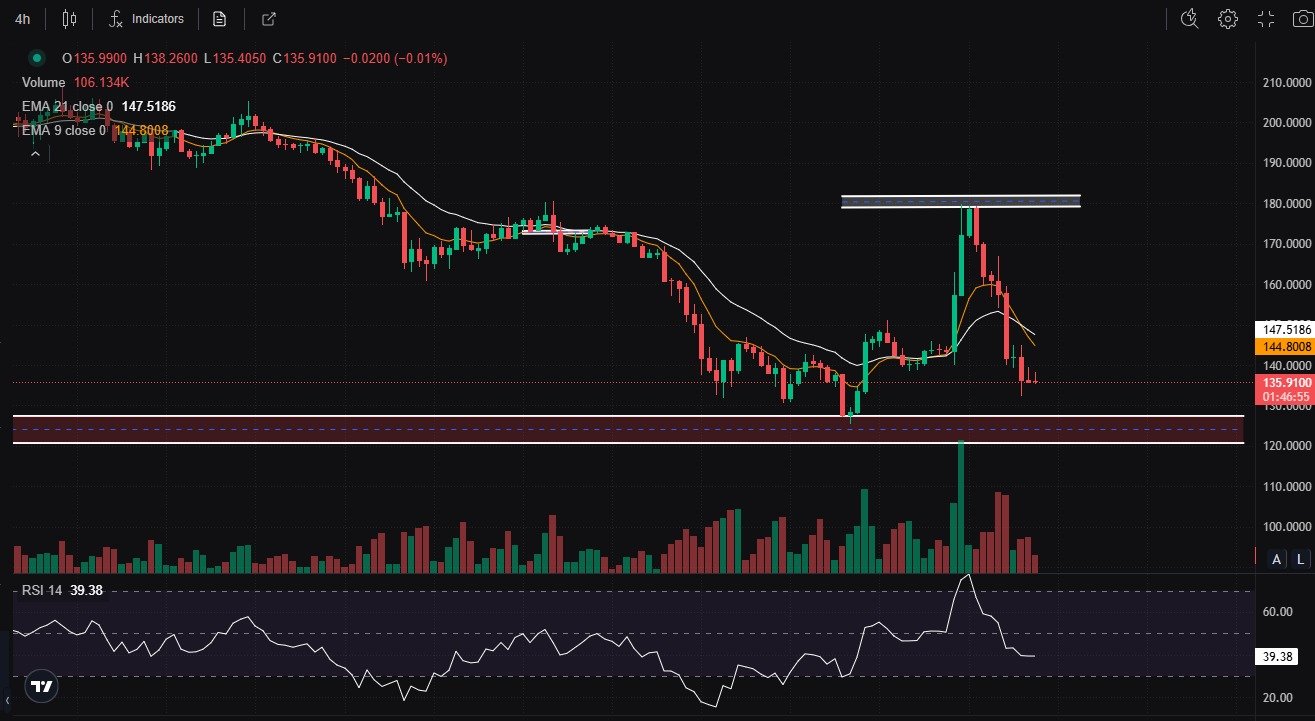
Solana (SOL) is nearing a crucial price zone between $120-$130, which will determine its next move. Currently trading at $135.91, SOL is significantly below its recent $180 resistance level. A failure to maintain support above $125 could trigger a further decline, with targets at $110 and potentially $80-$85.
SOL is trading below both EMAs, reinforcing the bearish trend. A reclaim of these levels is needed for any potential recovery.
3. Volume & RSI: Bears Dominate
• Volume: Increased selling pressure confirms the bearish trend.
• Relative Strength Index (RSI):39.38 (Approaching oversold conditions)
A drop below 30 on the RSI may signal an oversold condition, potentially triggering a short-term bounce. However, with high sell volume, the bearish trend remains intact.
Solana Price Prediction: Bearish Outlook Prevails
Bearish Scenario
• A confirmed breakdown below $125 could lead to a decline to $110.
• If $110 fails to hold, expect the next support at $80-$85, marking a significant drop.
• Downward-sloping EMAs and high sell volume suggest sellers are in control.
Bullish Scenario
• If SOL holds the $120-$130 support zone, a rebound towards $150-$160 is possible.
• A break above $180-$185 with strong volume may trigger a bullish reversal.
Conclusion: Bearish Sentiment Prevails
Currently, the market is controlled by bears, and long trades are not recommended. Traders should consider shorting SOL if the price breaks below $125, with a stop-loss at $135.
A bullish reversal would require a breakout above $180-$185 with solid volume. Until then, the bearish trend remains dominant, and further downside risks are high. Trade with caution.
Key Trading Signals:
Short Signal: If SOL breaks below $125, target $110.
Stop-Loss: Place stop-loss at $135 for short positions.
Long Signal: Only if SOL reclaims $180-$185 with significant volume.
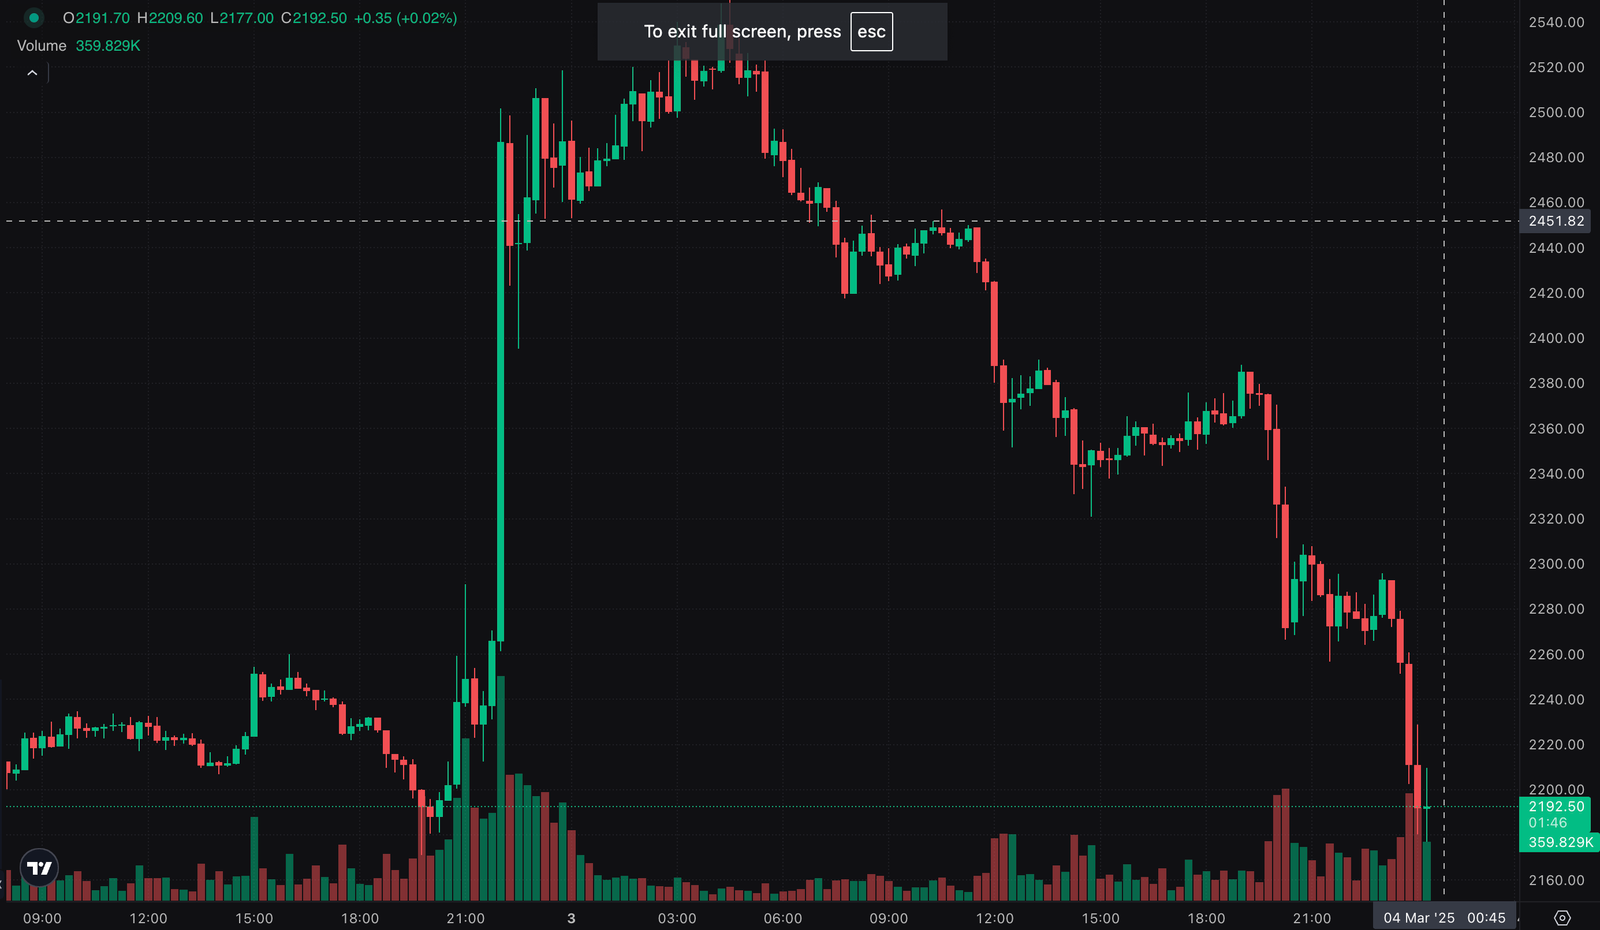
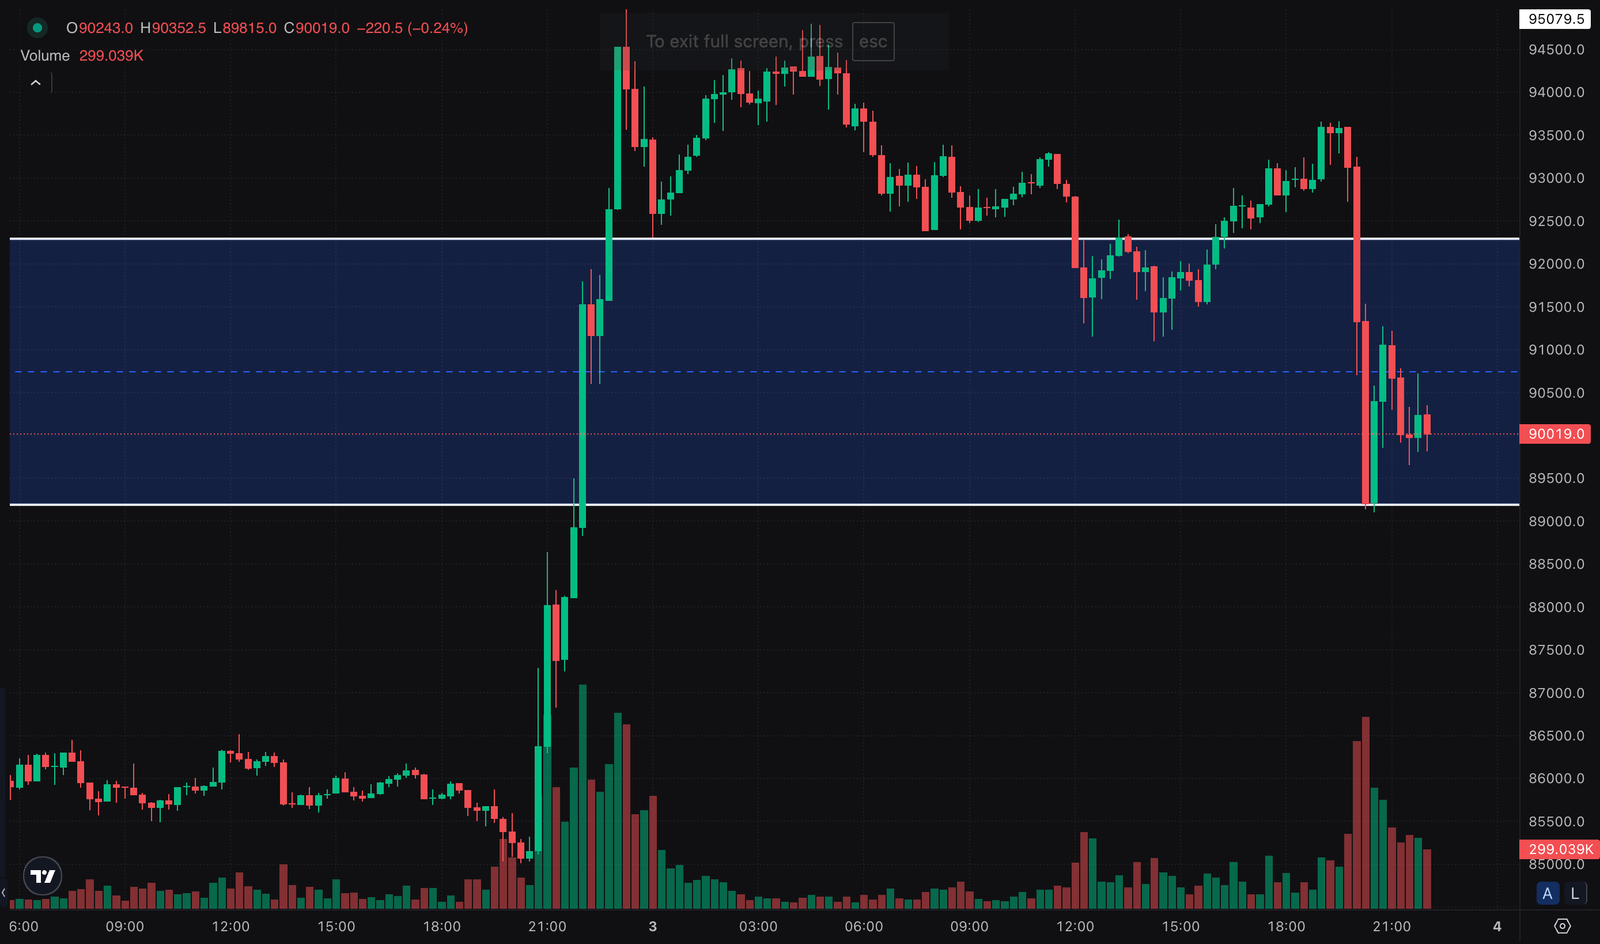
Ethereum (ETH/USD) is currently trading around $2,280, consolidating within a critical range. The price action suggests a potential breakout or breakdown scenario, depending on key support and resistance levels. Market participants should closely monitor these areas as they will define the next directional move for ETH.
Traders looking for ETH trading signals should keep a close eye on these levels.
ETH Trading Signal: Key Support and Resistance Levels
Immediate Support: $2,170 (Critical Level to Watch for ETH Trading Signal)
The $2,170 support zone is a key level where buyers have previously stepped in to prevent further declines. If ETH breaks and sustains below $2,170, it could signal a bearish move, triggering a deeper correction toward the next support.
• A breakdown below $2,170 would indicate increasing selling pressure, potentially signaling a further decline.
• If Ethereum holds above this level, it could stabilize and attempt a reversal toward higher price zones, offering a potential bullish ETH trading signal.
Major Support Levels: $2,050 and $1,910
If Ethereum fails to hold $2,170, the next critical support comes at $2,050, which aligns with previous accumulation areas. This level is crucial for maintaining bullish sentiment in the mid-term.
• A move below $2,050 could open the door for further downside, targeting $1,910, a historically strong demand zone.
• If ETH approaches $1,910 and establishes it as a *support zone, buyers may step in to defend this level, potentially leading to a rebound. However, if buying interest remains weak and ETH *fails to hold $1,910, the next downside target could be $1,700, signaling further bearish momentum and a negative ETH trading signal.
Immediate Resistance: $2,547 (Breakout Zone)
On the upside, $2,547 is the key resistance Ethereum needs to clear for a bullish continuation. This level has acted as a strong supply zone in recent price action, offering a crucial ETH trading signal for breakout traders.
• A breakout above $2,547 could confirm a trend reversal and shift momentum in favor of the bulls, providing a strong bullish ETH trading signal.
• Traders should watch for volume confirmation to validate the breakout.
Major Resistance: $2,860 (Upside Target for ETH Trading Signal)
If Ethereum surpasses $2,547, the next major target is $2,860, a crucial resistance level that aligns with previous swing highs.
• A move above $2,860 would strengthen the bullish case and could pave the way for a test of $3,000, a strong psychological level.
• Price action around this area will determine whether ETH can continue its upward trajectory, providing a potential ETH trading signal for further bullish movements.
Technical Indicators & Market Sentiment for ETH Trading Signal
Moving Averages (EMA & MA):
• ETH is currently trading near the 9-period EMA and 21-period MA, indicating a neutral to slightly bearish short-term outlook.
• A break above the moving averages could reinforce a bullish recovery, signaling a potential ETH trading signal for long positions.
Volume & Market Strength:
• Trading volume has seen fluctuations, indicating uncertainty among traders.
• If ETH experiences a volume surge near key levels, it could confirm the next major move, offering a reliable ETH trading signal.
Accumulation/Distribution Indicator:
• The Accum/Dist indicator shows mixed sentiment, suggesting a battle between bulls and bears.
• A rise in accumulation could indicate increasing buying interest, signaling a potential bullish ETH trading signal.
Conclusion & ETH Trading Signal Strategy
Ethereum is at a crucial price zone, where price action around $2,170 and $2,547 will determine its next move. Traders looking for ETH trading signals should watch for breakout or breakdown patterns to adjust their positions accordingly.
Bullish Scenario: A breakout above $2,547 could push ETH toward $2,860 and possibly $3,000, providing a clear ETH trading signal for further upward movement.
Bearish Scenario: A break below $2,170 may lead to a decline toward $2,050, with a further drop to $1,910 if selling pressure increases, signaling a bearish ETH trading signal.
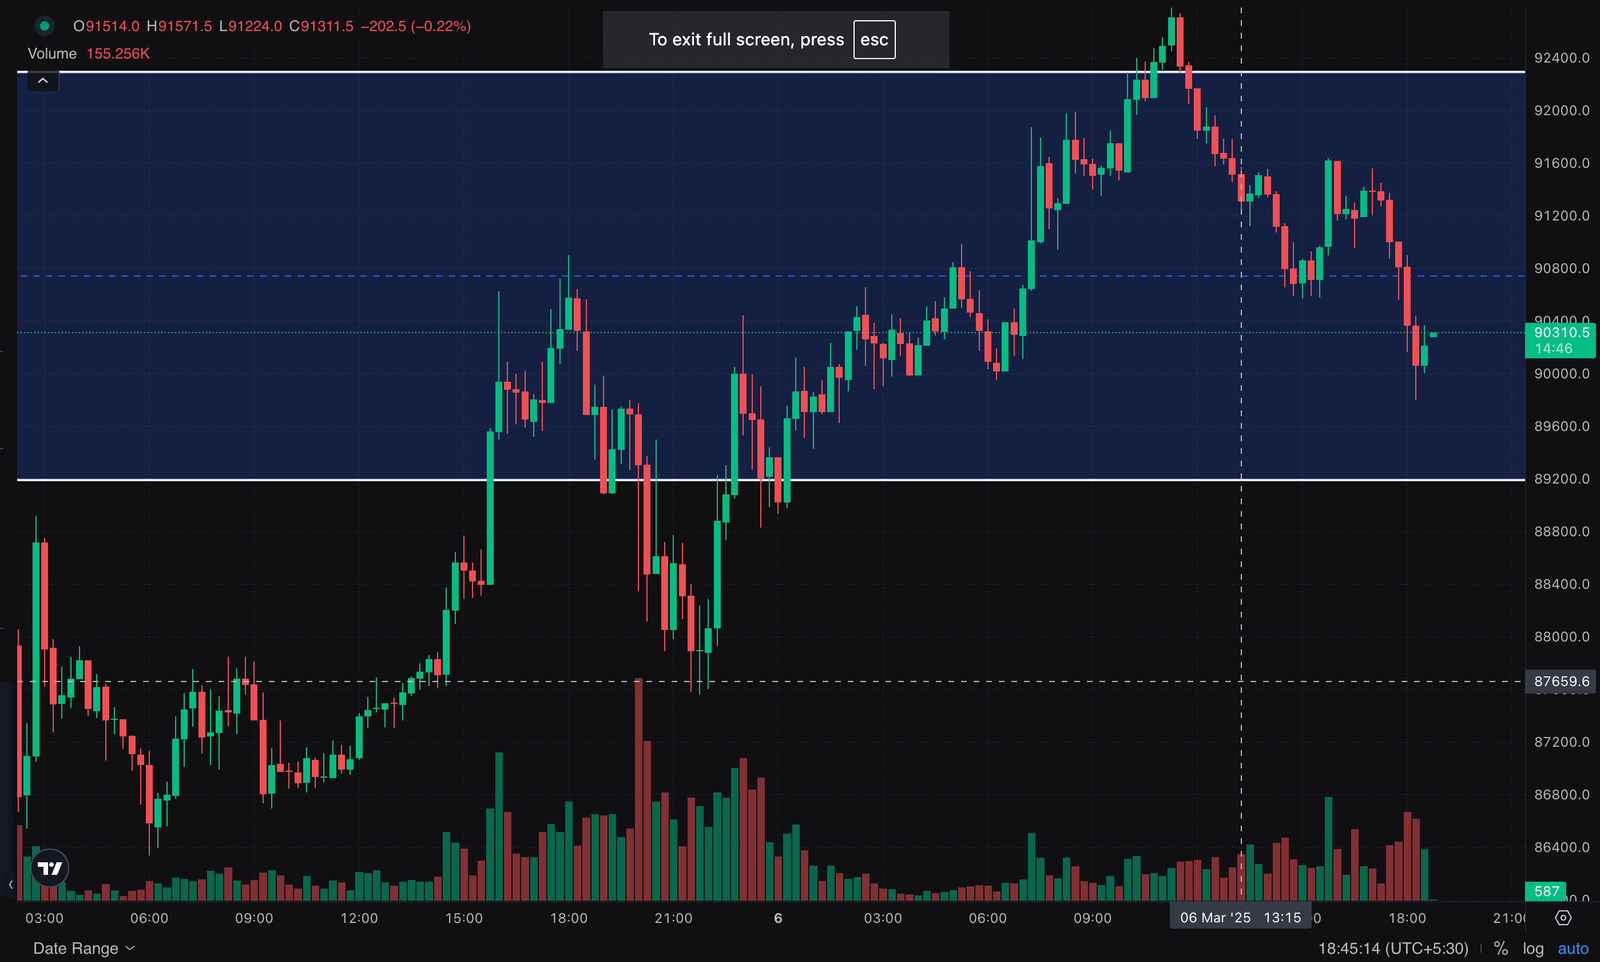
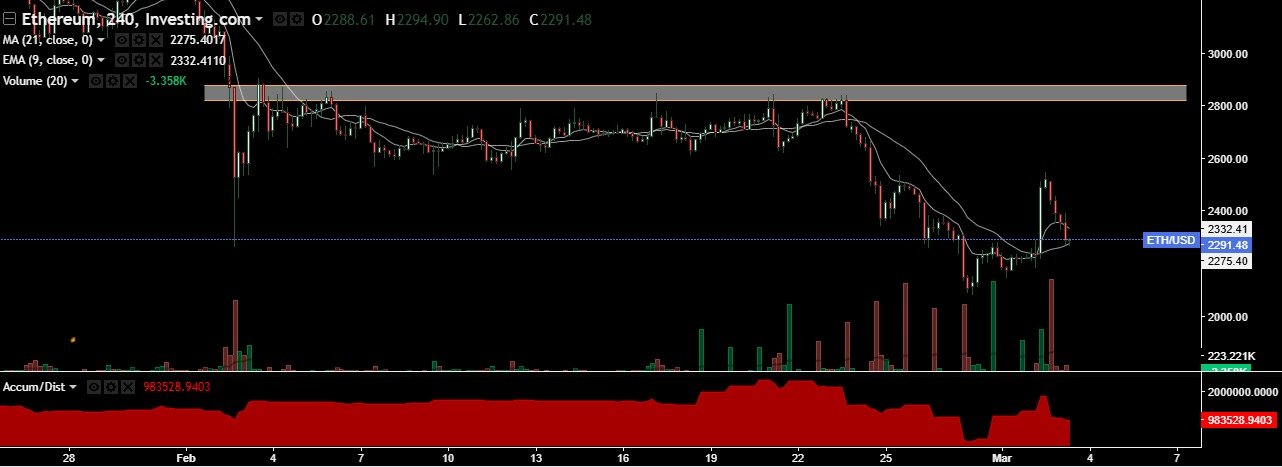
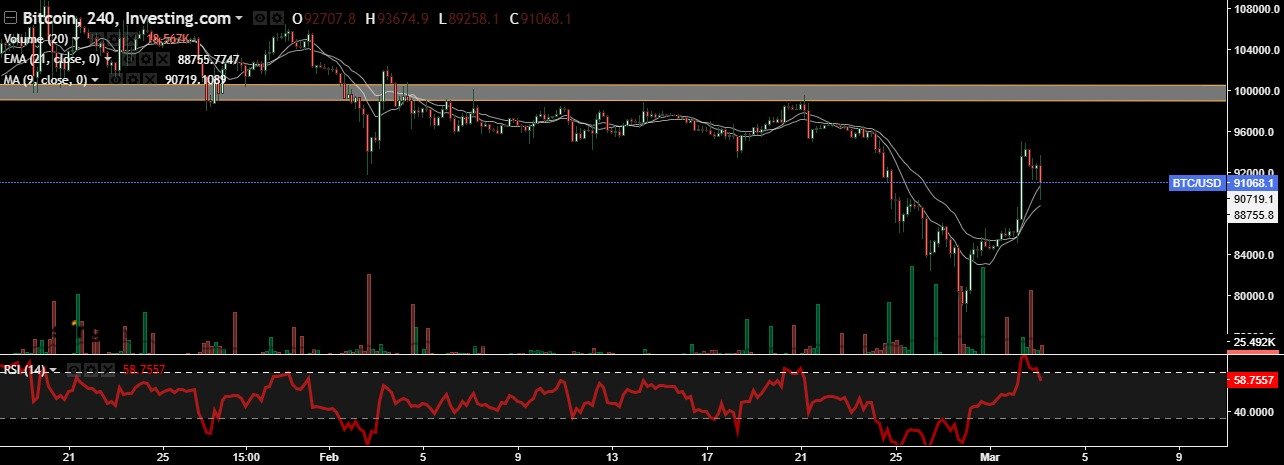
Bitcoin (BTC/USD) has been showing strong price action recently, attempting to recover from recent lows. As it navigates between crucial price zones, Bitcoin’s next directional move will largely depend on key resistance and support levels. Currently, Bitcoin is trading around $90,600, facing critical levels that traders should monitor for potential Bitcoin trading signals.
Key Bitcoin Trading Signal Levels: Support and Resistance Zones
The $95,000 level is a critical make-or-break level for Bitcoin. If Bitcoin breaks and sustains above this price point, it could signal a strong bullish breakout, leading to further gains. This resistance zone is where selling pressure has previously emerged, making it an important level to watch for potential bullish Bitcoin trading signals.
A decisive breakout above $95,000 will likely trigger increased buying activity, indicating a possible bullish trend continuation.
Traders should look for volume confirmation—if BTC surpasses this resistance with strong trading volume, it could be a signal of a bullish trend.
Major Resistance: $99,700 – $100,000 Psychological Barrier
Above $95,000, the next major resistance lies at $99,700, close to the psychological $100,000 level. Historically, this region has acted as both a strong resistance zone and a psychological barrier for Bitcoin.
Bitcoin could experience some profit-taking around this level before any potential continuation.
A clear breakout above $100,000 would likely trigger a bullish Bitcoin trading signal, opening the door for further upside momentum.
On the downside, $89,000 is an essential support level for Bitcoin. If Bitcoin holds above this level, it may indicate continued accumulation, offering a potential bullish Bitcoin trading signal for traders looking to capitalize on further upward momentum.
A bounce from $89,000 may signal ongoing buying interest and potential price recovery.
However, if Bitcoin breaks below this level, it could shift the market sentiment to bearish, potentially triggering a short-term bearish Bitcoin trading signal.
Major Support: $86,000 – Key Bearish Target
If Bitcoin fails to hold $89,000, the next major support level is at $86,000. This area has previously acted as a strong demand zone, where buyers have stepped in to defend Bitcoin from further declines.
A breakdown below $86,000 could signal the start of bearish momentum, opening the door for further downside.
The next potential support levels below $86,000 are in the $82,000-$80,000 range, which could be crucial for traders looking for bearish Bitcoin trading signals.
Conclusion & Bitcoin Trading Strategy
Bitcoin is currently hovering around critical make-or-break levels. Traders should closely monitor price action and volume confirmation at $95,000 and $89,000, as these levels will define the next major trend direction in the market.
Bullish Scenario: If Bitcoin breaks above $95,000, expect a run toward $99,000-$99,700. This would be a strong bullish Bitcoin trading signal.
Bearish Scenario: A break below $89,000 could send Bitcoin toward $86,000 and possibly lower, signaling a bearish Bitcoin trading signal.
By staying vigilant around these critical levels, traders can better time their entries and exits in the ever-evolving Bitcoin market.
In the world of options trading, the ability to generate consistent income is a top priority for traders. While many focus on buying options in hopes of high returns, professional traders often leverage the power of Mastering Option Selling to achieve steady and predictable profits. Option selling, or writing options, allows traders to capitalize on time decay and market stability, making it a preferred strategy for those looking to enhance their trading portfolio.
This comprehensive guide explores the art of option selling, including strategies, risk management, advantages, and the best practices to maximize earnings while minimizing risk.
Understanding Option Selling
Option selling involves writing or selling options contracts to collect premiums from buyers. Unlike option buyers, who profit from significant price movements, option sellers make money when the price remains stable or moves in their predicted direction.
There are two primary types of options that traders can sell:
Call Options: Selling a call option means you are obligated to sell the underlying asset at a predetermined price if the buyer exercises the option. This strategy works well in neutral to bearish markets.
Put Options: Selling a put option means you agree to buy the underlying asset if the price falls below a specified level. This approach is profitable in neutral to bullish conditions.
Successful option sellers must understand the four key option Greeks that influence price movement and risk exposure:
Theta (Time Decay): Theta measures how an option’s price decreases over time. Since option sellers collect premiums, they benefit as theta causes option prices to decline as expiration approaches.
Delta (Directional Risk): Delta represents how much an option’s price changes relative to the underlying asset. A lower delta (e.g., 0.30) means the option is less sensitive to price movements, making it ideal for sellers looking to reduce risk.
Gamma (Rate of Change of Delta): Gamma measures how fast delta changes with the underlying price movement. High gamma increases risk for sellers, so traders prefer selling options with low gamma to avoid sudden losses.
Vega (Implied Volatility Sensitivity): Vega indicates how much an option’s price will change based on volatility shifts. Option sellers prefer selling when implied volatility (IV) is high, as the premium collected is higher, and they can buy it back cheaper when IV drops.
Advantages of Option Selling
1. High Probability of Success
Statistics show that most options expire worthless, meaning sellers often retain the full premium. This gives option sellers an edge over buyers.
2. Earning Passive Income
By continuously selling options, traders can generate consistent cash flow, making it an excellent strategy for those seeking monthly or weekly income.
3. Profiting from Market Stability
Option sellers benefit from sideways, slightly bullish, or slightly bearish markets, unlike buyers who need substantial price movements to profit.
4. Benefit from Time Decay
The value of an option decreases over time due to theta decay. Since option sellers collect premiums upfront, this natural decline in price enhances profitability.
Popular Strategies
1. Covered Call Strategy
A covered call involves selling a call option while holding the underlying asset. This strategy is ideal for traders who own stocks and want to generate extra income while limiting risk.
Best for: Neutral to mildly bullish markets.
2. Cash-Secured Put Selling
This strategy involves selling a put option while keeping sufficient cash to buy the asset if assigned. This is useful for traders who want to buy stocks at a discount.
Best for: Neutral to slightly bullish markets.
3. Iron Condor
An iron condor is a combination of selling both put and call options with different strike prices to profit from low volatility.
Best for: Sideways markets with low volatility.
4. Bull Put and Bear Call Spreads: The Credit Spreads
These involve selling one option and buying another at a different strike price to limit risk while still profiting from time decay.
Best for: Moderately bullish or bearish markets.
Managing Risks in Option Selling
Although option selling provides consistent income, it comes with risks. Implementing proper risk management strategies is crucial to long-term success.
1. Set Stop-Loss Limits
Never hold onto losing trades for too long. Establish a predefined exit strategy to minimize losses.
2. Avoid Selling Naked Options
Selling options without owning the underlying asset or having a hedge can lead to unlimited risk, especially in volatile markets.
3. Diversify Your Positions
Don’t put all your capital into one trade. Spread out your risk across multiple contracts and expiration dates.
4. Use Technical & Fundamental Analysis
Before selling options, analyze market trends, support and resistance levels, and economic factors affecting price movements.
Best Practices for Successful Option Selling
Select High Probability Trades: Choose options with a high probability of expiring worthless (e.g., Delta below 0.30).
Monitor Implied Volatility (IV): Sell options when IV is high to collect higher premiums and buy them back when IV drops.
Trade Liquid Options: Stick to stocks and ETFs with high liquidity to ensure easy entry and exit.
Keep an Eye on Market Trends: Understand broader market movements and economic news that could affect option pricing.
Key Takeaways
Option selling is a powerful strategy that can generate consistent income for traders who understand managing risks and optimizing their trades. By leveraging time decay, implied volatility, and high-probability setups, traders can significantly improve their odds of success.
However, proper risk management and discipline are key to long-term profitability. Whether you are an experienced trader or a beginner, mastering option selling can provide a steady income stream and elevate your trading career to the next level.