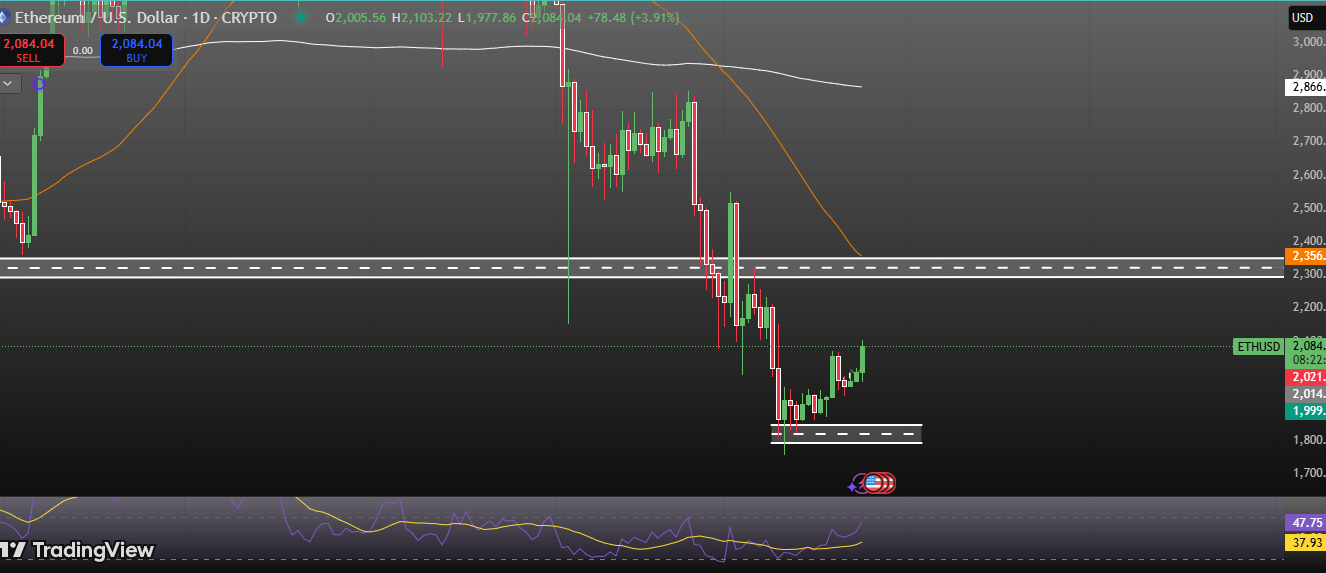
Ethereum (ETH) is currently trading at around $2078, showing a positive shift in market sentiment. However, despite recent upward movement, Ethereum is still facing resistance at key levels, and the overall market remains under pressure as it trades below its 50-day and 200-day moving averages.
The Relative Strength Index (RSI) is at 47, indicating that Ethereum may be nearing oversold conditions, suggesting that the price could be poised for a potential reversal in the coming days.
Key Resistance Levels
Ethereum is encountering immediate resistance at the $2100 level. A successful breakout above this price point will likely open the path for further upside movement toward the next resistance zone between $2150 and $2160. If ETH manages to surpass this critical resistance zone, the price could potentially rise toward the next significant target of $2300, signaling a potential shift into a neutral trend.
- Immediate Resistance: $2100
- Next Resistance Zone: $2150-$2160
- Near-Term Target: $2300
Key Support Levels
On the downside, Ethereum has immediate support within the $1950-$2000 range. The $2000 level, in particular, is a crucial psychological barrier. If the price falls below this support zone, it could signal a shift back into a bearish market structure, potentially leading to further downside movement. Therefore, maintaining support above $2000 is critical for Ethereum to continue its neutral outlook.
- Immediate Support: $1950-$2000
- Psychological Level: $2000
Market Structure and Price Action
Ethereum has demonstrated resilience by maintaining support in the range of $1850-$1900. This strong support zone has encouraged buyers to step in, leading to a potential move upside. Ethereum’s price action recently surpassed the previous week’s high, signaling that a change in market structure may be underway.
- Key Observation: Ethereum is breaking the previous week’s high.
- Bullish Outlook: A daily close above $2100 will likely confirm a shift from a bearish to a Neutral market structure.
Technical Indicators
- 50-Day and 200-Day Moving Averages: Ethereum is still trading below both its 50-day and 200-day moving averages, which indicates that the market remains in a neutral or bearish trend. A breakout above these key moving averages would be a significant signal of change in momentum.
- RSI (Relative Strength Index): The RSI currently stands at 47, suggesting that Ethereum is nearing oversold conditions. The RSI being below 50 indicates the price is still within a neutral zone, but the indicator’s approach to oversold levels may signal an imminent price reversal. Typically, an RSI below 30 signals oversold conditions, and the price could see an upward move if buying pressure intensifies.
- RSI Level: 47 (Approaching oversold territory)
- 50-Day and 200-Day Moving Averages: Currently below, signaling neutral to bearish trend
Key Levels to Watch
- Resistance at $2100: A decisive close above this level will signal the start of an upmove breakout, likely driving the price towards $2150-$2300.
- Resistance Zone at $2150-$2160: Ethereum’s ability to break and hold above this range will be crucial for further upside momentum.
- Support at $2000: The $2000 level is a major psychological and technical support level. If the price falls below this level, the bearish trend may resume.
Conclusion:
Ethereum’s technical outlook shows increasing strength, with strong support at $1850-$1900 and a potential breakout above $2100. Despite trading below the 50-day and 200-day moving averages, Ethereum’s price action suggests a short-term market structure change could be underway.
The RSI at 47 indicates that Ethereum is approaching oversold territory, which could signal a potential oversold if the buying pressure continues to build. A successful close above $2100 and sustained price action above the $2000 support level will likely confirm the shift into a Neutral with potential targets at $2150-$2300 in the near term.