A major Ethereum ICO investor has offloaded $ 4.5M in ETH while BlackRock buys $20M worth of ETH, sparking mixed reactions in the market.
An early Ethereum initial coin offering(ICO) investor has made a surprising market move, leaving crypto investors with mixed reactions regarding ETH and his motives. According to On-chain data, the wallet sent 1,500 ETH ($2.76M) to the Kraken exchange. Previously, in the same 24-hour period, the whale wallet had transferred another 1,000 ETH ($1.83M), signalling significant offloading.
The market has reacted to the whale wallet’s moves with mixed reactions. Having been an early ICO investor, traders question his motives, considering BlackRock has bought 11,000 ETH worth over $20 million in the same period.
BlackRock has been growing its Ethereum fund while other institutions like Trump’s World Liberty Financial believe in Ethereum’s rebound following a historical dip in Q1, 2025. So, does this early investor lack confidence in ETH’s bounce-back while institutional buying starts? Traders are closely watching ETH’s price at the $ 1800-1850 resistance zone to understand its next moves.
Ethereum’s monthly Relative Strength Index(RSI) has dropped to its most oversold ever, and whales are accumulating the dip. So, are ETH bulls rallying soon?
Ethereum has seen its price drop significantly as of Q1 2025. Despite other altcoins rallying after the trade war freeze, the king of altcoins saw a price exhaustion in a recovery attempt. As of this writing, ETH is trading at $1583 per CoinMarketCap data.
Looking at Ethereum’s 8-hour chart, the coin has been consolidating inside a descending channel pattern in Q1, 2025.
Source: X
With the price dropping to a 2-year low, ETH’s Relative Strength Index(RSI) has dropped to 40. This suggests that the coin is oversold, leaving the price in trenches. The bulls have stepped in as Ethereum’s momentum and MACD(12,26) flash “buy”.
WHALES HAVE BOUGHT OVER 200,000 $ETH IN THE LAST 3 DAYS. THEY’RE BUYING THE DIP!
With potential whale accumulation in the dip, ETH can break above the $1650 key resistance zone on its descending channel pattern. A confirmed breakout could see ETH rallying to $2800 in the next few weeks.
23,000 BTC and 177,000 ETH options are set to expire today. Is a price volatility on the horizon?
April 18th- The crypto market is at a critical moment with massive options anticipating expiry. Traders are closely watching price action with expectations of potential sharp price movements. With many altcoins having notable price correlation with Bitcoin, the ripple effect could spread accross the market.
According to Crypto Rover on X (formerly Twitter):
ETH is currently trading between two major supply zones, that is $1,540 and $1,630. Crypto analyst Ali Martinez has shared this insight, citing that a breakout on either side could define the next move for the king of altcoins.
Source: X
With Bitcoin and Ethereum leading the crypto market, significant volatility affecting their prices is a market concern. Investors are closely monitoring the market to make their next moves.
Ethereum (ETH) is currently trading at around $2078, showing a positive shift in market sentiment. However, despite recent upward movement, Ethereum is still facing resistance at key levels, and the overall market remains under pressure as it trades below its 50-day and 200-day moving averages.
The Relative Strength Index (RSI) is at 47, indicating that Ethereum may be nearing oversold conditions, suggesting that the price could be poised for a potential reversal in the coming days.
Key Resistance Levels
Ethereum is encountering immediate resistance at the $2100 level. A successful breakout above this price point will likely open the path for further upside movement toward the next resistance zone between $2150 and $2160. If ETH manages to surpass this critical resistance zone, the price could potentially rise toward the next significant target of $2300, signaling a potential shift into a neutral trend.
Immediate Resistance: $2100
Next Resistance Zone: $2150-$2160
Near-Term Target: $2300
Key Support Levels
On the downside, Ethereum has immediate support within the $1950-$2000 range. The $2000 level, in particular, is a crucial psychological barrier. If the price falls below this support zone, it could signal a shift back into a bearish market structure, potentially leading to further downside movement. Therefore, maintaining support above $2000 is critical for Ethereum to continue its neutral outlook.
Immediate Support: $1950-$2000
Psychological Level: $2000
Market Structure and Price Action
Ethereum has demonstrated resilience by maintaining support in the range of $1850-$1900. This strong support zone has encouraged buyers to step in, leading to a potential move upside. Ethereum’s price action recently surpassed the previous week’s high, signaling that a change in market structure may be underway.
Key Observation: Ethereum is breaking the previous week’s high.
Bullish Outlook: A daily close above $2100 will likely confirm a shift from a bearish to a Neutral market structure.
Technical Indicators
50-Day and 200-Day Moving Averages: Ethereum is still trading below both its 50-day and 200-day moving averages, which indicates that the market remains in a neutral or bearish trend. A breakout above these key moving averages would be a significant signal of change in momentum.
RSI (Relative Strength Index): The RSI currently stands at 47, suggesting that Ethereum is nearing oversold conditions. The RSI being below 50 indicates the price is still within a neutral zone, but the indicator’s approach to oversold levels may signal an imminent price reversal. Typically, an RSI below 30 signals oversold conditions, and the price could see an upward move if buying pressure intensifies.
RSI Level: 47 (Approaching oversold territory)
50-Day and 200-Day Moving Averages: Currently below, signaling neutral to bearish trend
Key Levels to Watch
Resistance at $2100: A decisive close above this level will signal the start of an upmove breakout, likely driving the price towards $2150-$2300.
Resistance Zone at $2150-$2160: Ethereum’s ability to break and hold above this range will be crucial for further upside momentum.
Support at $2000: The $2000 level is a major psychological and technical support level. If the price falls below this level, the bearish trend may resume.
Conclusion:
Ethereum’s technical outlook shows increasing strength, with strong support at $1850-$1900 and a potential breakout above $2100. Despite trading below the 50-day and 200-day moving averages, Ethereum’s price action suggests a short-term market structure change could be underway.
The RSI at 47 indicates that Ethereum is approaching oversold territory, which could signal a potential oversold if the buying pressure continues to build. A successful close above $2100 and sustained price action above the $2000 support level will likely confirm the shift into a Neutral with potential targets at $2150-$2300 in the near term.
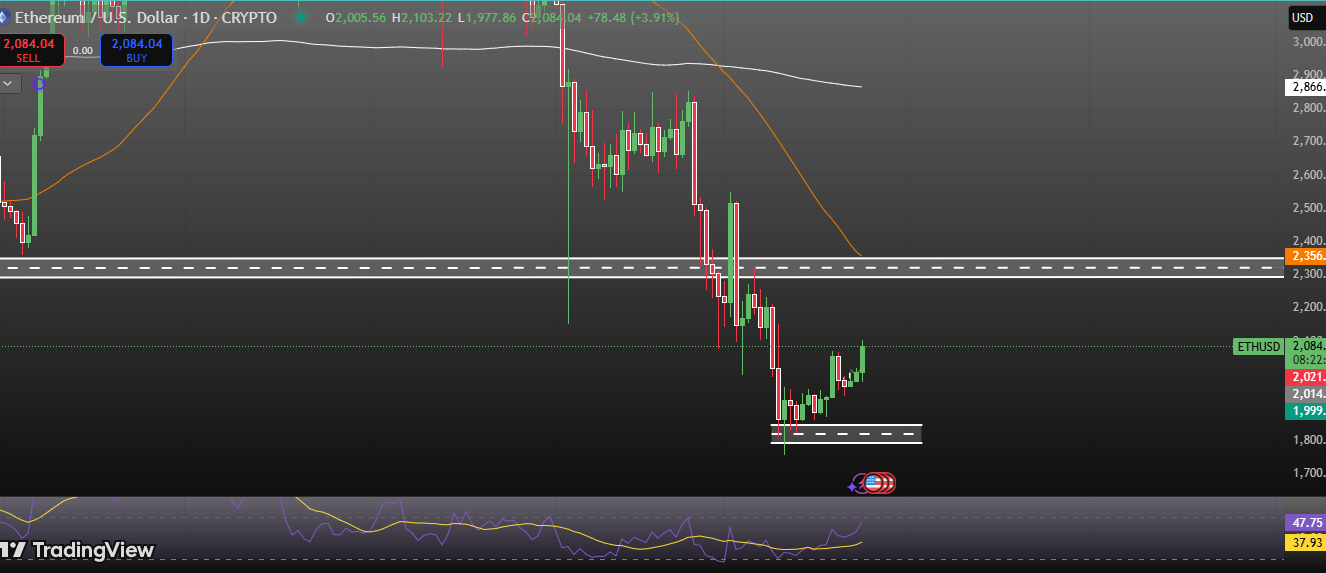
Ethereum (ETH) is currently trading at $1,884, with price action consolidating within the $1,820 – $1,950 range over the past 4-5 days. This period of tight consolidation suggests that an explosive move could be imminent, either to the upside or downside.
The global economic uncertainty, trade wars, and macroeconomic factors continue to impact market sentiment, making risk management crucial for traders.
Technical Levels:
Support Zones:
$1,800 – $1,820 → Strong support level where buyers are holding firm.
$1,740 – $1,750 → Next potential downside target if the key support at $1,800 fails.
Resistance Zones:
$1,950 – $1,960 → Immediate resistance level.
$2,000 → Critical psychological and technical hurdle.
$2,100 → Upside target if ETH breaks and holds above $2,000.
Relative Strength Index (RSI): The RSI is approaching oversold territory, indicating a potential rebound from support levels.
Volume Analysis: Declining volume near resistance and support levels suggests a possible breakout or breakdown is imminent.
Potential Price Scenarios:
Bullish Breakout:
If Ethereum breaks above $2,000 and sustains momentum, it could trigger a rally toward $2,100.
A confirmed breakout above $2,100 could set the stage for a move toward $2,200 – $2,250 in the coming weeks.
Bearish Breakdown:
If Ethereum fails to hold the $1,800 support level, a breakdown could push the price toward $1,740 – $1,750.
A sustained move below $1,740 would open the doors for further downside, possibly retesting the $1,700 – $1,680 range.
Market Sentiment & Trading Strategy:
Volatility Alert: The ongoing price compression signals a potential volatility surge. Traders should prepare for a significant move.
Risk Management: Utilize stop-loss orders, maintain a hedging strategy, and avoid directional bias in this uncertain market environment.
Confirmation is Key: To reduce risk exposure, wait for a confirmed breakout or breakdown before entering new positions.
Conclusion:
Ethereum’s price action is at a critical juncture, with traders closely watching the $1,800 support and $2,000 resistance levels. A breakout above $2,000 could trigger bullish momentum, while a breakdown below $1,800 could lead to further downside pressure.
With increasing macro uncertainties, traders need to adopt cautious and well-informed strategies. Stay updated and manage risk effectively in these volatile market conditions.
Disclaimer:
This report is for informational purposes only and should not be considered financial advice. Trade at your own risk.
In a major development for the cryptocurrency investment space, Fidelity Investments has proposed adding staking capabilities to its Ethereum Exchange-Traded Fund (ETF).
This move aims to enhance the fund’s offerings by allowing investors to earn rewards through Ethereum’s proof-of-stake mechanism, reinforcing bullish sentiment around Ethereum’s potential in traditional finance.
CBOE Files Proposal with SEC
The Chicago Board Options Exchange (CBOE) has formally submitted a proposal to the U.S. Securities and Exchange Commission (SEC) to integrate staking into Fidelity’s Ethereum ETF.
If approved, this would mark a significant milestone in bridging traditional financial markets with blockchain technology, offering institutional and retail investors direct exposure to Ethereum’s staking rewards and strengthening Ethereum’s position as a yield-generating asset.
Expanding Ethereum’s Role in Traditional Finance
Fidelity’s proposal comes at a time when Ethereum staking is gaining traction as an attractive way for investors to earn passive income. By allowing ETF holders to participate in staking, the investment giant aims to make Ethereum a more functional and rewarding asset within regulated financial products.
This move further solidifies Ethereum’s standing as a bullish force in institutional finance.
Market Impact and Regulatory Considerations
The move to introduce staking into ETFs could reshape the crypto investment landscape, but it also raises regulatory questions. The SEC has historically taken a cautious approach to cryptocurrency staking, citing concerns around security classification and investor protection.
Approval of this proposal could set a precedent for similar offerings from other financial institutions, further boosting the legitimacy of Ethereum staking in mainstream finance.
Key Takeaways:
Ethereum Staking in ETFs – Fidelity seeks to include staking in its Ethereum ETF.
CBOE’s SEC Filing – The exchange has submitted a request to enable staking functionality.
Passive Income for Investors – ETF holders could earn staking rewards if approved.
Bullish Ethereum Outlook – Institutional adoption and staking integration could drive long-term demand.
Regulatory Uncertainty – The SEC’s decision will be crucial for future staking-based financial products.
The Road Ahead
As traditional financial institutions continue to embrace crypto innovations, the inclusion of staking in ETFs could open new opportunities for Ethereum adoption and institutional involvement. Investors and industry participants are closely watching the SEC’s response, which could shape the future of Ethereum ETFs and staking in regulated markets.
Will Fidelity’s bold move pave the way for other financial giants to follow? The bullish case for Ethereum ETFs continues to grow, and market participants are eagerly awaiting the next developments.
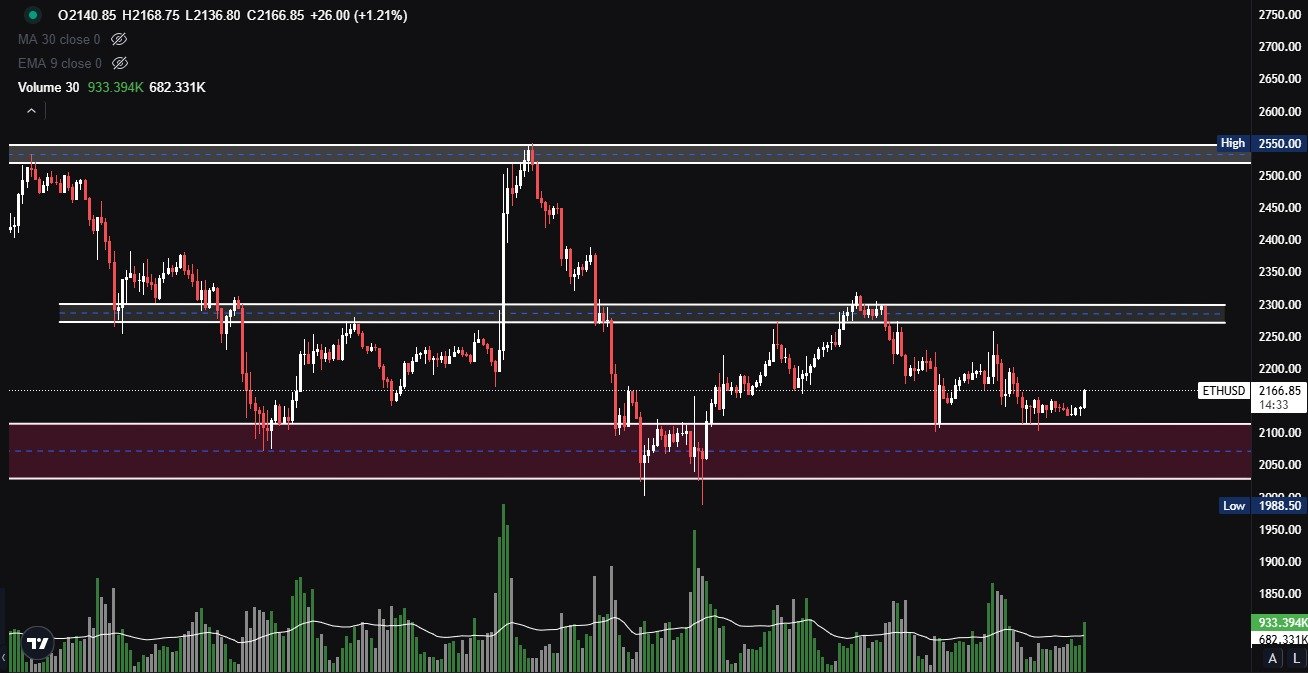
Ethereum (ETH) is currently in a consolidation phase, trading between the $2,050 – $2,320 range. The price has tested both support and resistance zones multiple times, indicating a potential breakout in either direction.
This technical analysis examines key support and resistance levels, potential price movements, and critical breakout zones to help traders make informed decisions.
Ethereum (ETH) Key Levels Analysis
Support Zone: $2,050 – $2,100
Ethereum has been holding strong within this support range.
Buyers have consistently entered near $2,050, preventing a further decline.
A breakdown below $2,000 could trigger a bearish continuation, leading to further price depreciation.
Immediate Resistance: $2,300 – $2,320
ETH faces selling pressure in this range.
If ETH successfully breaks and sustains above $2,320, an upward movement toward higher resistance levels is likely.
The next target after breaking $2,320 is $2,530 – $2,550, where strong resistance is expected.
Major Resistance: $2,530 – $2,550
This level represents a strong supply zone, where ETH has previously faced rejection.
A successful breakout above $2,550 could confirm a shift in momentum toward higher targets.
Key Upside Level: $2,820 – $2,840
If ETH breaks $2,550 and maintains momentum, it could rally toward $2,820 – $2,840, marking a major technical breakout.
This level will act as a key psychological and technical resistance.
Downside Risk: Below $2,000
If ETH fails to sustain $2,000 – $2,020, the price could decline further.
A breakdown below $2,000 may lead to a drop toward $1,930 – $1,950, indicating a shift in market sentiment.
ETH Price Action and Market Outlook
Ethereum’s price action is currently at a critical inflection point. A break above $2,320 could confirm upward momentum, pushing ETH toward the $2,550 resistance zone. Conversely, failure to hold $2,000 could indicate a deeper correction toward $1,930 – $1,950.
Trading Strategies Based on Technical Analysis:
Upward Strategy:
Look for a confirmed breakout above $2,320, targeting $2,530 – $2,550.
If ETH holds above $2,550, consider long positions with a target of $2,820 – $2,840.
Downward Strategy:
A breakdown below $2,000 could signal a shorting opportunity toward $1,930 – $1,950.
Traders should monitor volume and momentum indicators for confirmation.
Final Thoughts: Ethereum Price Prediction
Ethereum’s price movement remains in a consolidation phase, but key support and resistance zones indicate a potential breakout. Traders should closely watch the $2,320 resistance and $2,000 support levels for directional bias.
A breakout above $2,550 could open doors for further price movement, while a breakdown below $2,000 may result in a further decline.
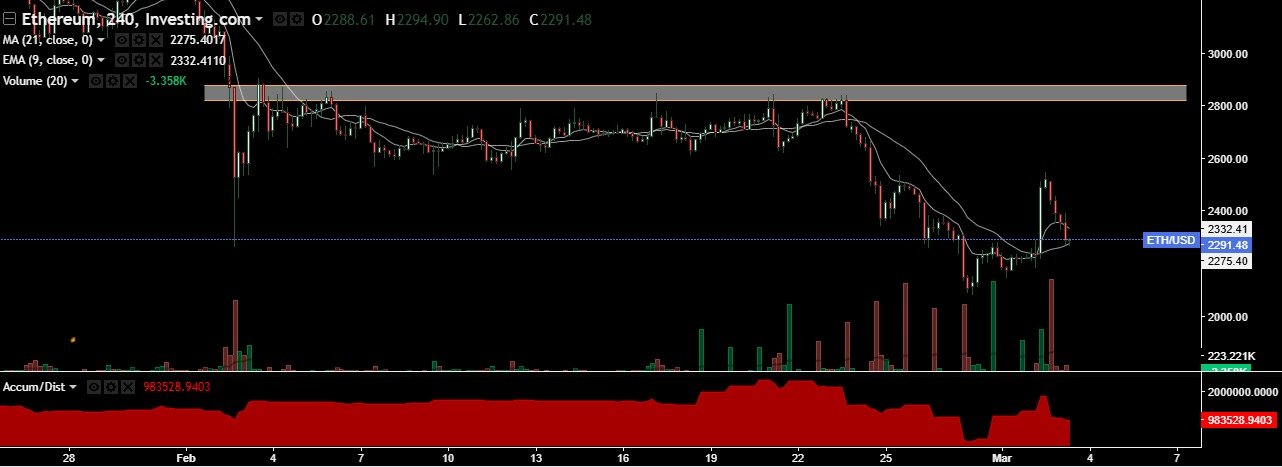
Ethereum (ETH/USD) is currently trading around $2,280, consolidating within a critical range. The price action suggests a potential breakout or breakdown scenario, depending on key support and resistance levels. Market participants should closely monitor these areas as they will define the next directional move for ETH.
Traders looking for ETH trading signals should keep a close eye on these levels.
ETH Trading Signal: Key Support and Resistance Levels
Immediate Support: $2,170 (Critical Level to Watch for ETH Trading Signal)
The $2,170 support zone is a key level where buyers have previously stepped in to prevent further declines. If ETH breaks and sustains below $2,170, it could signal a bearish move, triggering a deeper correction toward the next support.
• A breakdown below $2,170 would indicate increasing selling pressure, potentially signaling a further decline.
• If Ethereum holds above this level, it could stabilize and attempt a reversal toward higher price zones, offering a potential bullish ETH trading signal.
Major Support Levels: $2,050 and $1,910
If Ethereum fails to hold $2,170, the next critical support comes at $2,050, which aligns with previous accumulation areas. This level is crucial for maintaining bullish sentiment in the mid-term.
• A move below $2,050 could open the door for further downside, targeting $1,910, a historically strong demand zone.
• If ETH approaches $1,910 and establishes it as a *support zone, buyers may step in to defend this level, potentially leading to a rebound. However, if buying interest remains weak and ETH *fails to hold $1,910, the next downside target could be $1,700, signaling further bearish momentum and a negative ETH trading signal.
Immediate Resistance: $2,547 (Breakout Zone)
On the upside, $2,547 is the key resistance Ethereum needs to clear for a bullish continuation. This level has acted as a strong supply zone in recent price action, offering a crucial ETH trading signal for breakout traders.
• A breakout above $2,547 could confirm a trend reversal and shift momentum in favor of the bulls, providing a strong bullish ETH trading signal.
• Traders should watch for volume confirmation to validate the breakout.
Major Resistance: $2,860 (Upside Target for ETH Trading Signal)
If Ethereum surpasses $2,547, the next major target is $2,860, a crucial resistance level that aligns with previous swing highs.
• A move above $2,860 would strengthen the bullish case and could pave the way for a test of $3,000, a strong psychological level.
• Price action around this area will determine whether ETH can continue its upward trajectory, providing a potential ETH trading signal for further bullish movements.
Technical Indicators & Market Sentiment for ETH Trading Signal
Moving Averages (EMA & MA):
• ETH is currently trading near the 9-period EMA and 21-period MA, indicating a neutral to slightly bearish short-term outlook.
• A break above the moving averages could reinforce a bullish recovery, signaling a potential ETH trading signal for long positions.
Volume & Market Strength:
• Trading volume has seen fluctuations, indicating uncertainty among traders.
• If ETH experiences a volume surge near key levels, it could confirm the next major move, offering a reliable ETH trading signal.
Accumulation/Distribution Indicator:
• The Accum/Dist indicator shows mixed sentiment, suggesting a battle between bulls and bears.
• A rise in accumulation could indicate increasing buying interest, signaling a potential bullish ETH trading signal.
Conclusion & ETH Trading Signal Strategy
Ethereum is at a crucial price zone, where price action around $2,170 and $2,547 will determine its next move. Traders looking for ETH trading signals should watch for breakout or breakdown patterns to adjust their positions accordingly.
Bullish Scenario: A breakout above $2,547 could push ETH toward $2,860 and possibly $3,000, providing a clear ETH trading signal for further upward movement.
Bearish Scenario: A break below $2,170 may lead to a decline toward $2,050, with a further drop to $1,910 if selling pressure increases, signaling a bearish ETH trading signal.