XRP Reclaims $2 Resistance -Is $2.5 the next target?

1 0
Read Time:55 Second

XRP has hit $2 following a 14% surge as the crypto market rebounds from the trenches.


Following a week of turmoil in the global economies and over $1 billion in crypto liquidations, the market could be poised for stabilization. Many altcoins are seeing a rebound from the market dip, with XRP rallying 14% in the last 24 hours. Per CoinMarketCap, XRP was trading at $1.99 at press time.

XRP could be eyeing $2.5 in the mid-term

Looking at XRP’s technical setup, the coin’s MACD is on the verge of a bullish crossover. This could be a potential confirmation signal of XRP’s uptrend rally as it secures a daily close above $2. According to CryptoAndy, on CoinMarketCap, capital inflow into the market could see XRP target $2.5 next after breaking above this level.


Source: CoinMarketCap

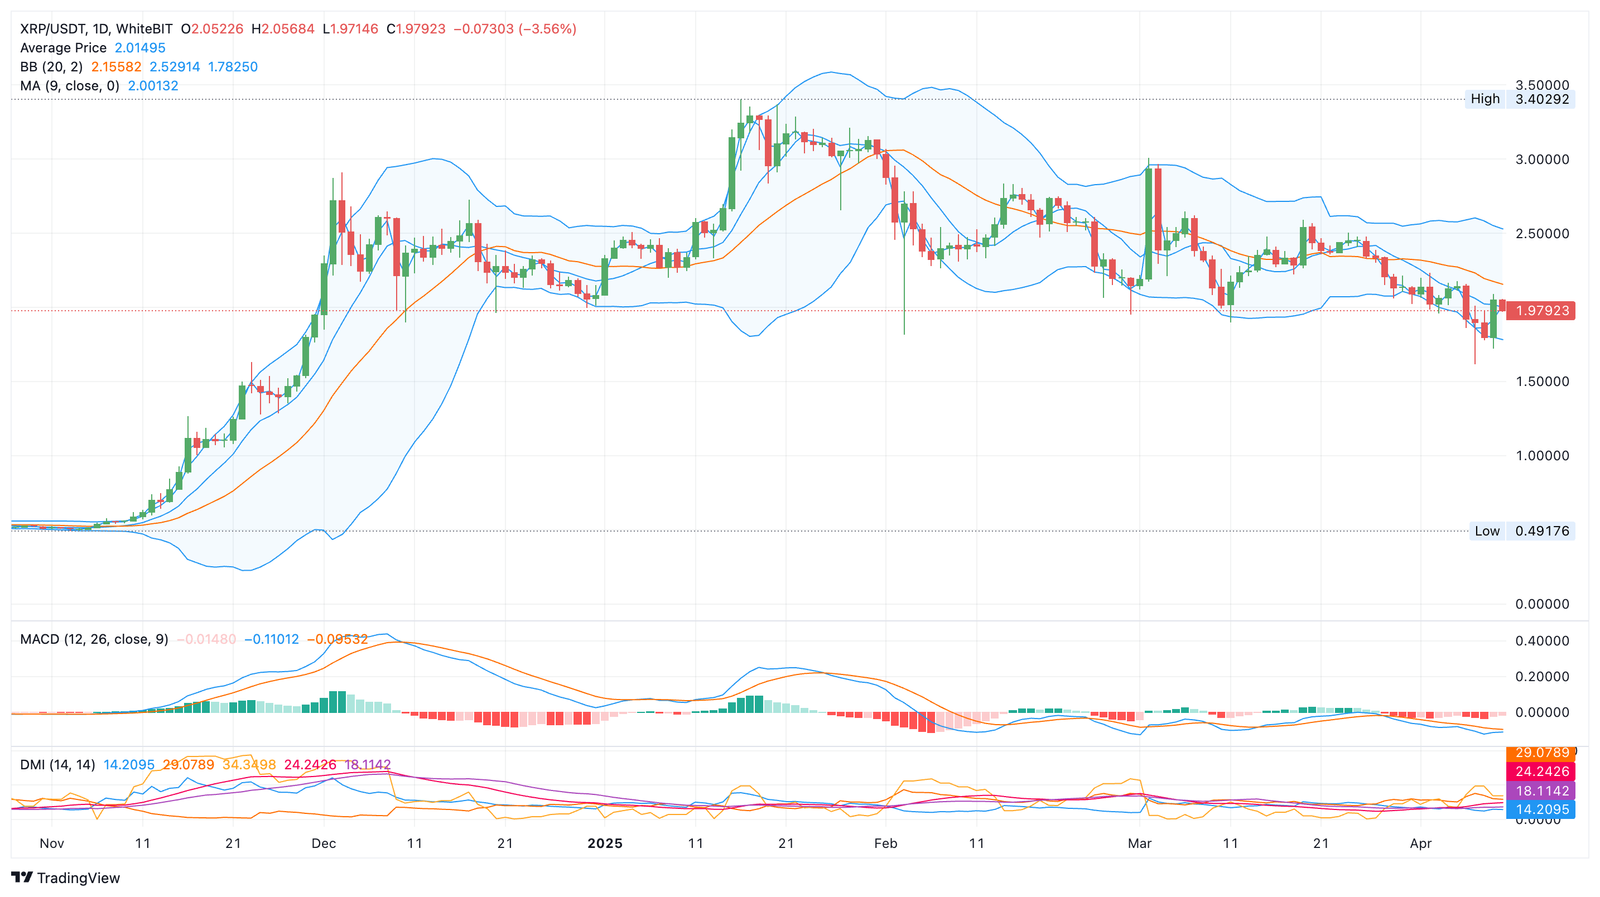
As the market recovers from the trade war, traders entering new positions could strengthen XRP’s bullish momentum. With open interest rising, one should keep an eye on the altcoin’s next moves at this level.

Happy
0 0 %
Sad
0 0 %
Excited
0 0 %
Sleepy
0 0 %
Angry
0 0 %
Surprise
0 0 %

Bitcoin Price Prediction: (BTC) Technical Analysis Report

0 0
Read Time:1 Minute, 51 Second

The recent price action in Bitcoin (BTC) suggests significant selling pressure, with bears firmly in control. The market is displaying a pattern of lower highs and lower lows, reinforcing the ongoing downtrend.

Buyers appear to be on the weaker side, as each bullish attempt is met with strong resistance and subsequent rejection.

Key Observations from the Chart:

  1. Price Action & Trend Analysis:
    • BTC is currently trading near the support zone of $79,000 – $80,000.
    • If BTC breaks below $78,000, it could trigger a further sell-off, potentially dragging the price towards the next major support at $72,000 – $73,000.
    • On the upside, BTC faces immediate resistance at $83,000 – $84,000.
    • A breakout above this level could lead to a move toward the next resistance level at $87,000.
  2. Moving Averages:
    • The 30-period moving average (MA) is at $82,056.9, acting as dynamic resistance.
    • The 9-period Exponential Moving Average (EMA) is at $82,031.4, which is also trending downward, signaling continued bearish momentum.
  3. Volume Analysis:
    • Volume bars indicate a spike in selling activity, confirming the bearish dominance.
    • Increased volume on bearish candles suggests strong selling interest, reinforcing the possibility of further downside movement.
  4. Support & Resistance Levels:
    • Immediate Support: $79,000 – $80,000
    • Breakdown Level: $78,000 (Break below this could accelerate selling pressure toward $72,000 – $73,000)
    • Immediate Resistance: $83,000 – $84,000
    • Breakout Level: $87,000 (Above this level, BTC could push towards new highs)

Conclusion & Trading Outlook:

  • Bearish Scenario: If BTC loses the $78,000 support level, the next major downside target is $72,000 – $73,000. Given the prevailing selling pressure, traders should be cautious about entering long positions unless signs of a reversal emerge.
  • Bullish Scenario: A breakout above $83,000 – $84,000 could shift market sentiment and drive BTC towards $87,000. However, until this level is breached, the market remains bearish.
  • Recommendation: Traders should closely monitor $78,000 for a breakdown and $83,000 – $84,000 for a potential bullish reversal. Risk management is crucial in the current volatile environment.

Disclaimer: This analysis is for informational purposes only and does not constitute financial advice. Always conduct your research before making any trading decisions.

Happy
0 0 %
Sad
0 0 %
Excited
0 0 %
Sleepy
0 0 %
Angry
0 0 %
Surprise
0 0 %
Exit mobile version