Solana has taken the top spot, leading Ethereum in daily decentralized trading volume amid a 3.5% price surge.
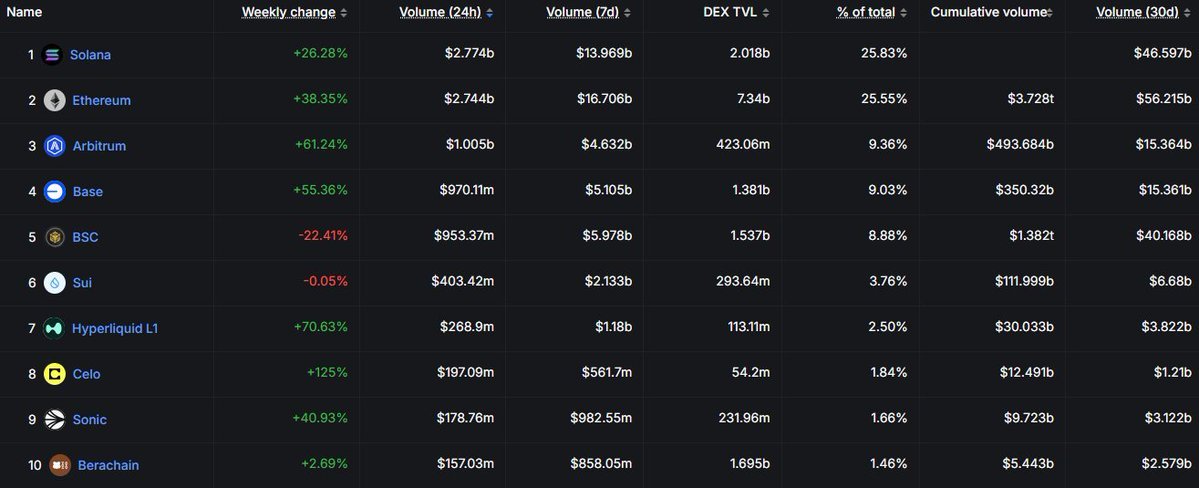
Solana and Ethereum networks account for 57% of the total trading volume from the top 10 decentralized exchanges (DEXs) in the market. In the past 24 hours, Solana has seen its DEX trading volume steadily rise, pulling ahead of Ethereum to lead the DEX pack.
According to data shared by Crypto Rand on CoinMarketCap, Solana’s 24-hour DEX volume hit $2.774 billion while Ethereum rallied behind holding 2.744 billion.
Source: CoinMarketCap
Why is Solana’s price and DEX volume surging?
Solana’s fast transaction speed and lower gas fees could be enticing for traders following a week of market frustration fueled by the global trade war. Users are likely hunting for cheaper and quicker alternatives to Ethereum-based DEXs, for instance, Jupiter and Raydium.
Despite lagging behind Solana in the past 24 hours, Ethereum remains unshakable as a DEX powerhouse in the market.
In a groundbreaking development for the cryptocurrency market, Volatility Shares is set to debut the first-ever Solana ETF on March 20.
This marks a significant milestone in the institutional adoption of Solana, providing investors with new ways to gain exposure to the blockchain’s native asset, SOL.
🚨 BREAKING: The first-ever Solana futures ETFs are launching tomorrow.
Volatility Shares is debuting two ETFs:
• SOLZ: Tracks Solana futures
• SOLT: Offers 2x leveraged exposure pic.twitter.com/Wt2gt6oBPc
Volatility Shares will introduce two exchange-traded funds (ETFs):
🔹 SOLZ – Tracks Solana ETF futures, offering a direct way to invest in SOL price movements.
🔹 SOLT – Provides 2x leveraged exposure to Solana ETF futures, catering to traders seeking amplified returns.
Why Solana ETFs Matter
The launch of these Solana ETFs signals a growing interest in Solana as a key player in the crypto ecosystem. Following the approval of Bitcoin and Ethereum futures ETFs, this move further legitimizes Solana in the eyes of institutional investors. It also opens the door for increased market participation and liquidity in Solana ETF futures trading.
Market Impact & Expectations
With Solana’s network gaining momentum in DeFi and NFT sectors, these ETFs could drive fresh capital inflows and increased trading activity. Analysts will be closely watching how these Solana ETFs perform and their impact on SOL’s price action in the coming days.
As the first of their kind, the Solana ETFs could set a precedent for future altcoin-based investment products, further bridging the gap between traditional finance and the crypto sector.
Stay tuned for further updates as the Solana ETFs go live! 🚀
Solana (SOL) has been experiencing a significant downtrend, with the price making a recent low at $112 following a strong sell-off. Currently, a pullback is occurring from this level, with SOL attempting to regain lost ground. However, the market remains bearish, and key resistance and support levels must be closely monitored.
Key Levels:
Immediate Resistance:$128-$130 – The price is currently testing this level. A breakout above this zone could push SOL towards higher resistance levels.
Next Resistance Zone:$145-$150 – If the price successfully breaches the $128-$130 resistance, this area will act as the next major hurdle.
Immediate Support:$110-$112 – This level has strongly supported the recent sell-off. If broken, a deeper decline is likely.
Major Support Level:$80-$85 – A breakdown below the $110-$112 support zone could send SOL towards this critical support area.
Technical Indicators:
Moving Averages:
The 30-period Moving Average (MA) is currently at $122.4529, indicating a bearish trend.
The 9-period Exponential Moving Average (EMA) is at $122.9541, suggesting that the price is attempting to consolidate after the recent sell-off.
Volume Analysis:
The volume profile indicates increased trading activity around the recent lows, which may signal potential accumulation.
However, higher volume with upward momentum is required for a confirmed trend reversal.
Market Sentiment & Trend Analysis:
The overall trend remains bearish, as evidenced by the consistent lower highs and lower lows.
Caution is advised against entering long positions until the price starts closing above $165-$170, which would indicate a potential trend reversal.
If SOL fails to break above the $128-$130 resistance, it could face renewed selling pressure, leading to a possible retest of lower support levels.
Conclusion: Solana (SOL) is currently facing key resistance at $128-$130, and a breakout above this level could open the door for further upside towards $145-$150. However, if SOL fails to clear this resistance, the price may decline towards $110-$112, with a further downside risk to $80-$85 in a prolonged bearish scenario.
Given the current market conditions, traders should exercise caution and wait for a confirmed bullish breakout above $165-$170 before considering long positions.
Disclaimer: This analysis is for informational purposes only and should not be considered financial advice. Always conduct your research before making any trading decisions.
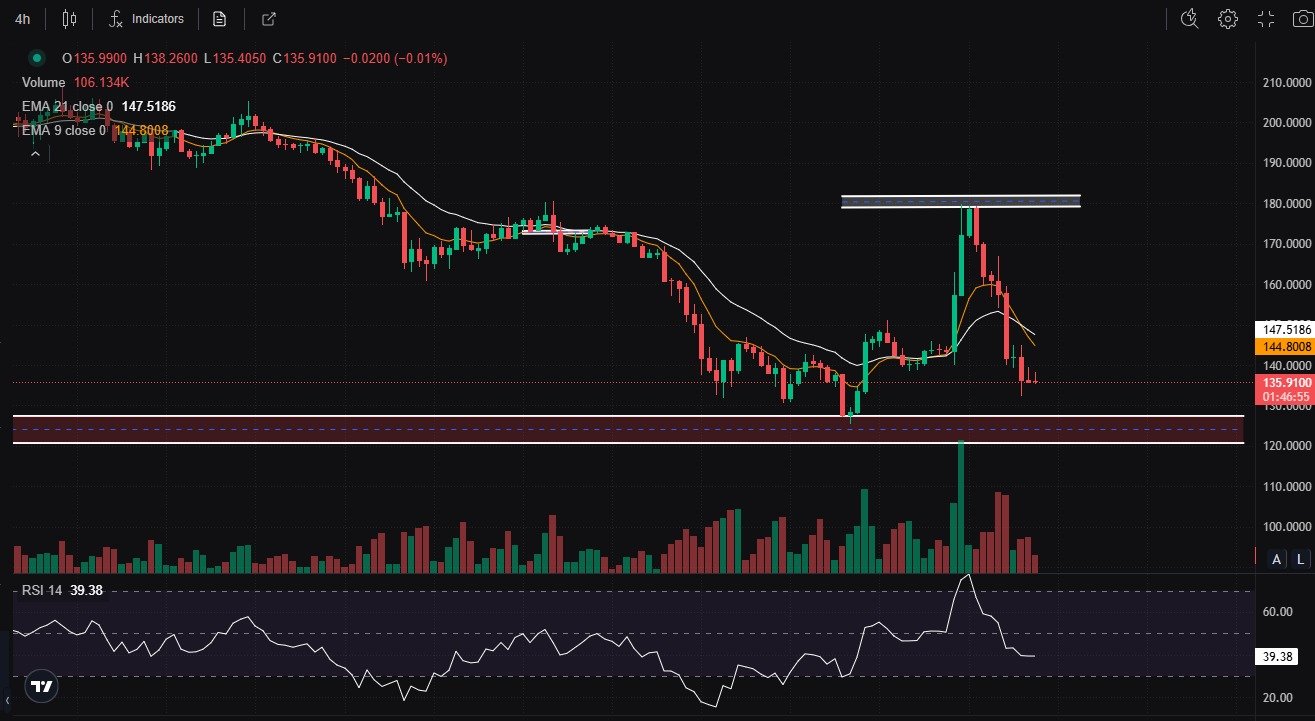
Solana (SOL) is nearing a crucial price zone between $120-$130, which will determine its next move. Currently trading at $135.91, SOL is significantly below its recent $180 resistance level. A failure to maintain support above $125 could trigger a further decline, with targets at $110 and potentially $80-$85.
SOL is trading below both EMAs, reinforcing the bearish trend. A reclaim of these levels is needed for any potential recovery.
3. Volume & RSI: Bears Dominate
• Volume: Increased selling pressure confirms the bearish trend.
• Relative Strength Index (RSI):39.38 (Approaching oversold conditions)
A drop below 30 on the RSI may signal an oversold condition, potentially triggering a short-term bounce. However, with high sell volume, the bearish trend remains intact.
Solana Price Prediction: Bearish Outlook Prevails
Bearish Scenario
• A confirmed breakdown below $125 could lead to a decline to $110.
• If $110 fails to hold, expect the next support at $80-$85, marking a significant drop.
• Downward-sloping EMAs and high sell volume suggest sellers are in control.
Bullish Scenario
• If SOL holds the $120-$130 support zone, a rebound towards $150-$160 is possible.
• A break above $180-$185 with strong volume may trigger a bullish reversal.
Conclusion: Bearish Sentiment Prevails
Currently, the market is controlled by bears, and long trades are not recommended. Traders should consider shorting SOL if the price breaks below $125, with a stop-loss at $135.
A bullish reversal would require a breakout above $180-$185 with solid volume. Until then, the bearish trend remains dominant, and further downside risks are high. Trade with caution.
Key Trading Signals:
Short Signal: If SOL breaks below $125, target $110.
Stop-Loss: Place stop-loss at $135 for short positions.
Long Signal: Only if SOL reclaims $180-$185 with significant volume.
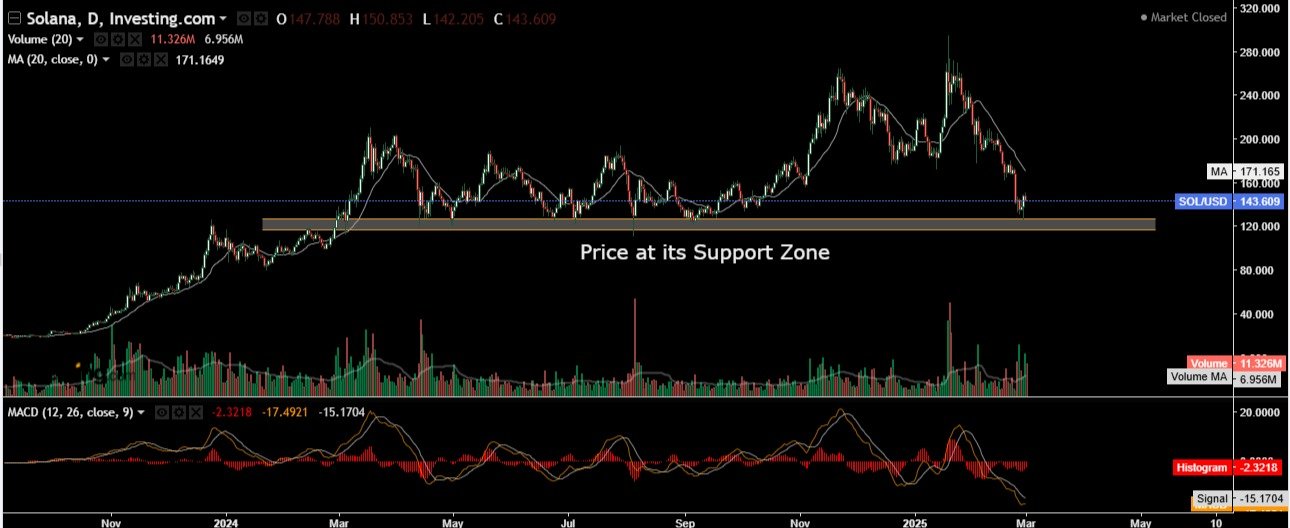
Solana price (SOL/USD) is testing a crucial demand zone as selling pressure intensifies. This analysis evaluates key support levels, technical indicators, and potential price action scenarios to provide a clearer outlook for traders and investors.
Key Technical Levels and Breakdown Risks
Support Zone: Solana price is currently trading near a major support range between $120-$130. A breakdown below this level could accelerate losses.
20-Day Moving Average: The 20-day MA stands at $171.16, reinforcing the bearish momentum.
Critical Breakdown Level: A decisive close below $110 on the daily, weekly, or monthly timeframe could confirm a deeper decline towards $80-$85.
Next Major Demand Zone: If Solana price fails to hold $80, the next significant support is around $50.
Indicator Analysis
Volume and Market Sentiment
Current Volume:11.32M, significantly above the 6.95M moving average, indicating heightened selling pressure.
Momentum Outlook: The MACD remains in bearish territory, with no signs of an immediate recovery.
Key Support and Resistance Levels
Immediate Resistance:$160, followed by the $171.16 MA.
Major Support:$110 (critical level to hold).
Downside Targets: If $110 breaks, expect a drop to $80-$85. A failure at this level could drive the price down to $50.
Price Action Scenarios
Bearish Continuation: A daily, weekly, or monthly close below $110 will likely lead to a move toward $80-$85. If this level fails, $50 becomes the next major target.
Demand Zone Holds: If buyers defend the $120-$130 range, a relief rally toward $140-$160 is possible.
Trend Reversal Confirmation: A breakout above $178 could signal a shift in momentum, attracting fresh buying interest.
Conclusion
Solana price faces a critical test at its demand zone. A weekly or monthly close below $110 would confirm a bearish continuation, with $80-$85 as the next support. If this level fails, $50 could be the final defense. Conversely, holding above $110 may trigger a short-term rebound. Traders should closely monitor closing prices for confirmation of the next major move.