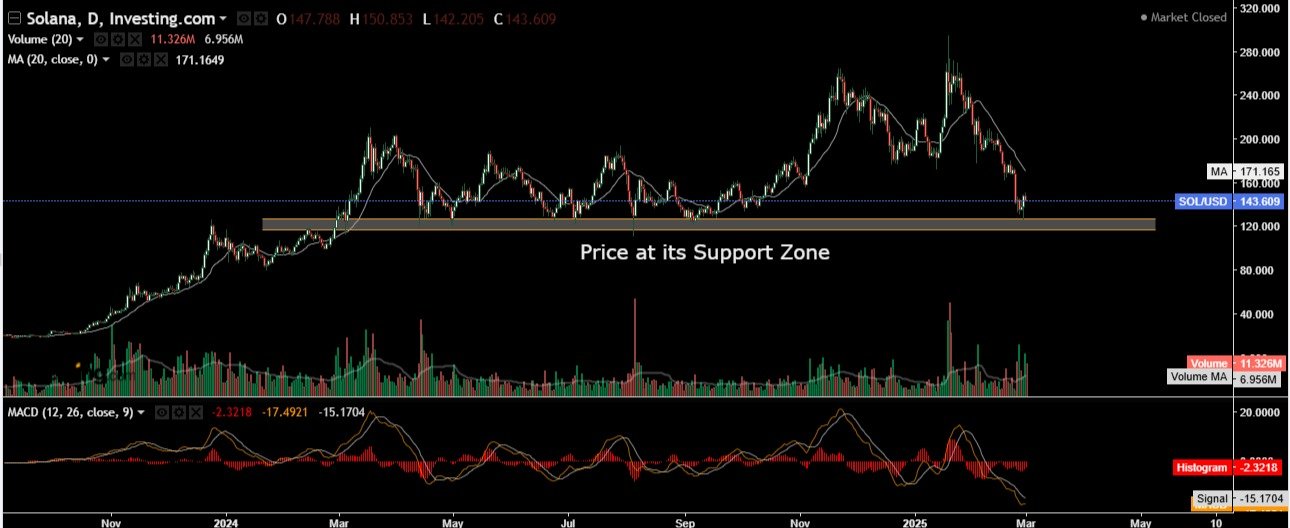
Solana (SOL) is currently trading at approximately $125, consolidating within the $120-$130 range on the daily time frame. This zone is acting as a crucial support level, and any breakdown below this range may trigger a further decline toward $110-$112.
Conversely, if buyers step in and push the price higher, the immediate resistance lies between $132-$137. A successful breakout above this level could lead to $148-$152.
Despite the recent pullback, buyers have shown weak momentum, as the price has repeatedly failed to sustain higher levels on larger time frames. SOL remains below the 200-day moving average, reinforcing the bearish sentiment and indicating that the broader market trend is still downward.


Key Technical Levels:
- Immediate Support: $120-$130 – A key range where the price is consolidating. A breakdown below this level could accelerate selling pressure.
- Major Support Zone: $110-$112 – If the $120-$130 range fails to hold, the next significant support lies at $110-$112, where buyers may attempt to regain control.
- Immediate Resistance: $132-$137 – A breakout above this level could trigger a short-term bullish move.
- Next Resistance Zone: $148-$152 – If SOL clears the $132-$137 resistance, this area will be the next upside target.
- Bearish Confirmation Level: Below $110 – If the price breaks below $110, the downtrend could extend significantly, possibly targeting lower support levels around $80-$85.
Technical Indicators & Market Sentiment:
- Moving Averages:
- 200-Day Moving Average: SOL is trading below the 200-day MA, a strong bearish indicator suggesting the price is in a long-term downtrend.
- 30-Day MA & 9-Day EMA: Shorter moving averages indicate that price action is still struggling to establish a sustainable upward move.
- Volume Analysis:
- Trading volume remains relatively low, suggesting a lack of strong buying interest.
- If the price approaches key resistance levels with high volume, it may indicate potential bullish momentum.
- Trend Analysis:
- Solana remains in a bearish structure, consistently forming lower highs and lower lows.
- The price needs to break above the 200-day moving average and establish higher highs to confirm a trend reversal.
Market Outlook & Conclusion:
Solana’s price action suggests that the market is still in a bearish phase, as evidenced by its failure to sustain higher levels and continued trading below the 200-day moving average.
The $120-$130 support zone remains a key level to watch—if it holds, SOL may attempt an upside move toward $132-$137 and possibly $148-$152. However, failure to hold this support could result in a deeper decline to $110-$112, with a more bearish scenario targeting $80-$85.
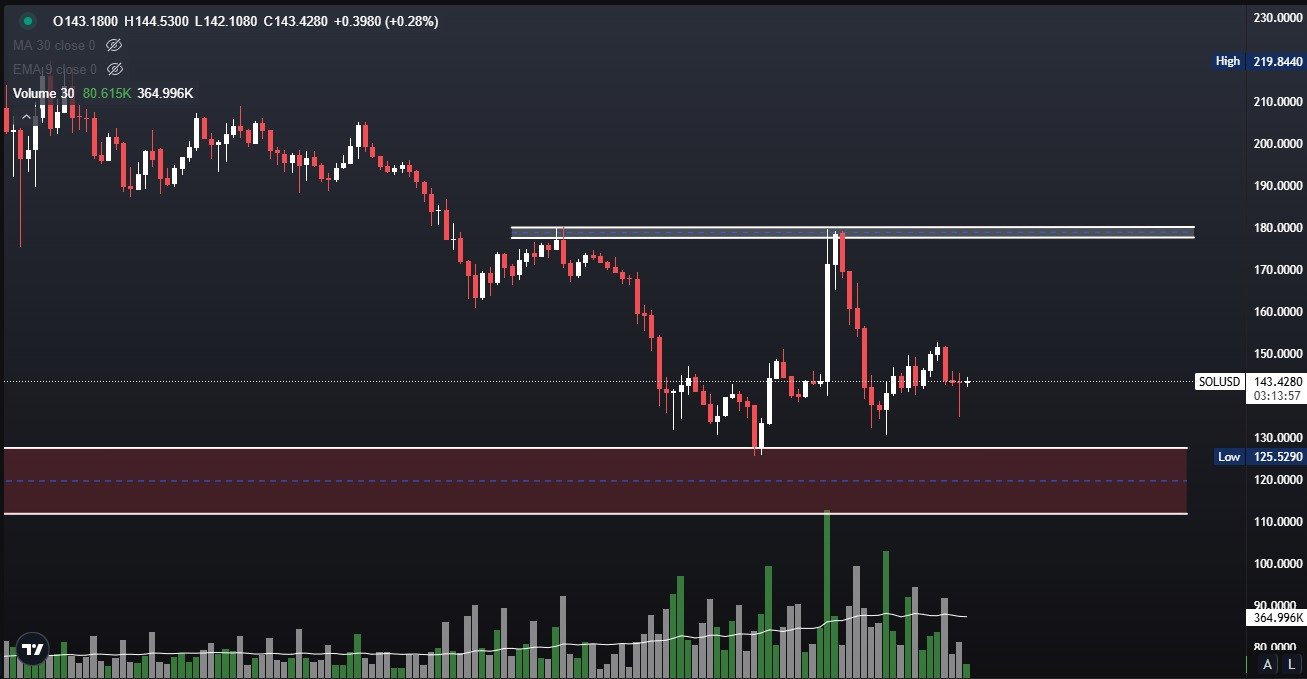
Given the overall downtrend, traders should exercise caution and wait for a clear breakout above $170-$180 or a confirmed bullish structure before considering long positions. Until then, SOL remains bearish territory, and short-term rallies should be viewed as potential selling opportunities rather than trend reversals.
Disclaimer: This analysis is for educational purposes only and should not be considered financial advice.