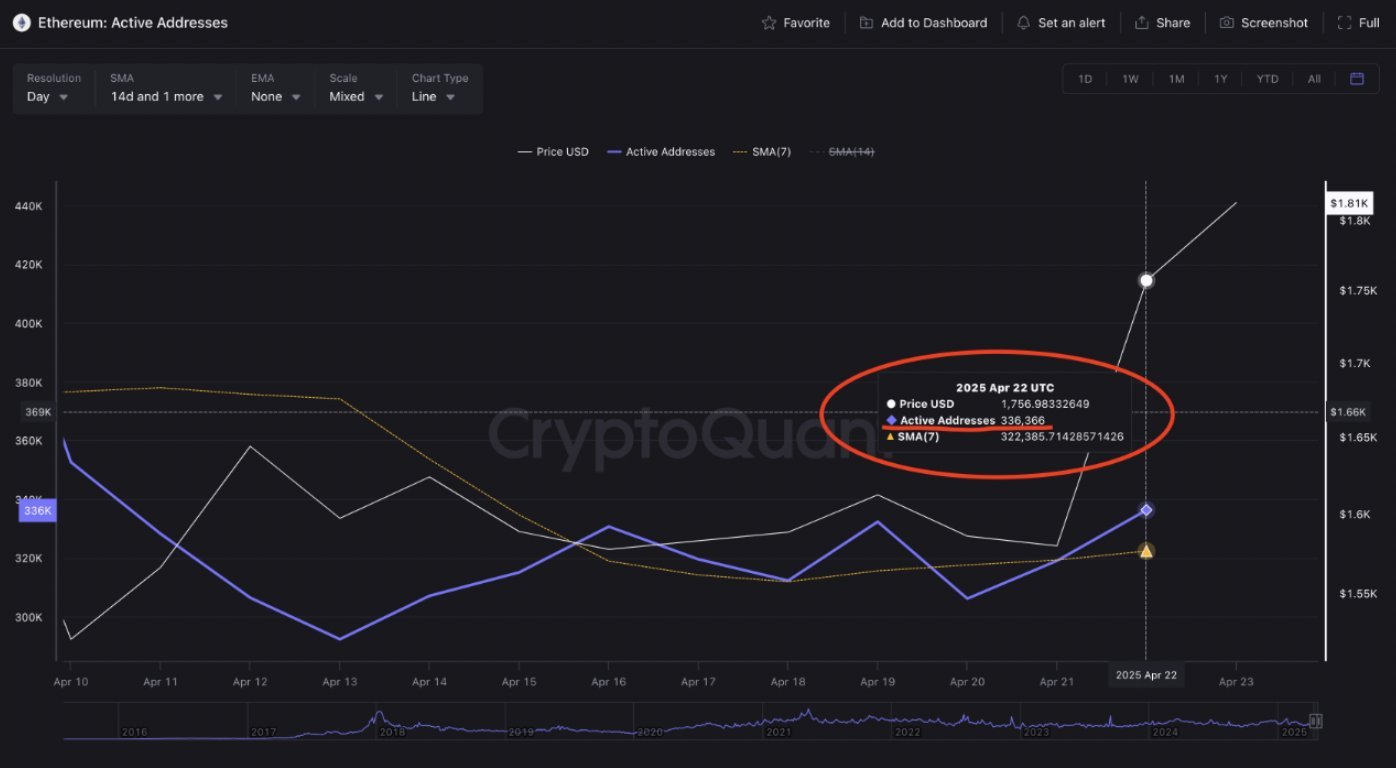
Ethereum active addresses have jumped from 306,211 to 336,366, a 9.85% surge in the past 48 hours. Is this a sign of renewed investor interest?
Ethereum has seen its price fall to a 2-year low as of April 2025. In the past week, Scoopist noted that the king of altcoins was hitting the oversold zone as prices plunged.
Cryptoquant data has revealed a surge in Ethereum’s active addresses, signalling market activity. According to the on-chain metrics, ETH’s active addresses jumped from 306,211 to 336,366 in the past 48 hours, reflecting a nearly 10% increase.
Source: Cryptoquant
What does this mean for ETH?
ETH has surged notably amid the rising on-chain activity, hitting the $1800 mark. A sudden rise in active addresses could signal more than just renewed investor interest. This could be a sign of whales buying the dip, considering ETH was oversold.
Despite the current price volatility, this could suggest Ethereum’s rebound is imminent as the bulls take charge. Traders are closely watching the coins’ on-chain activity to determine their next moves.
Ethereum’s monthly Relative Strength Index(RSI) has dropped to its most oversold ever, and whales are accumulating the dip. So, are ETH bulls rallying soon?
Ethereum has seen its price drop significantly as of Q1 2025. Despite other altcoins rallying after the trade war freeze, the king of altcoins saw a price exhaustion in a recovery attempt. As of this writing, ETH is trading at $1583 per CoinMarketCap data.
Looking at Ethereum’s 8-hour chart, the coin has been consolidating inside a descending channel pattern in Q1, 2025.
Source: X
With the price dropping to a 2-year low, ETH’s Relative Strength Index(RSI) has dropped to 40. This suggests that the coin is oversold, leaving the price in trenches. The bulls have stepped in as Ethereum’s momentum and MACD(12,26) flash “buy”.
WHALES HAVE BOUGHT OVER 200,000 $ETH IN THE LAST 3 DAYS. THEY’RE BUYING THE DIP!
With potential whale accumulation in the dip, ETH can break above the $1650 key resistance zone on its descending channel pattern. A confirmed breakout could see ETH rallying to $2800 in the next few weeks.
23,000 BTC and 177,000 ETH options are set to expire today. Is a price volatility on the horizon?
April 18th- The crypto market is at a critical moment with massive options anticipating expiry. Traders are closely watching price action with expectations of potential sharp price movements. With many altcoins having notable price correlation with Bitcoin, the ripple effect could spread accross the market.
According to Crypto Rover on X (formerly Twitter):
ETH is currently trading between two major supply zones, that is $1,540 and $1,630. Crypto analyst Ali Martinez has shared this insight, citing that a breakout on either side could define the next move for the king of altcoins.
Source: X
With Bitcoin and Ethereum leading the crypto market, significant volatility affecting their prices is a market concern. Investors are closely monitoring the market to make their next moves.
Trump, through World Liberty Financial, is holding a crypto portfolio consisting of 94% Ethereum blockchain. What does he know?
U.S President Donald Trump is holding a crypto portfolio that is surprisingly going almost fully into Ethereum. Despite recent market volatility and rumoured sell-offs, World Liberty Financial has kept a strong hand on the Ethereum blockchain. With so many projects full of potential in the market, Crypto enthusiasts wonder what could be the reason for this.
Source: X
The possible reasons for such a portfolio
Ethereum is not just an ordinary coin but a bridge connecting a huge DeFi, NFTs, and Smart Contracts ecosystem. World Liberty Financial was established to promote digital freedom, financial independence, and the tokenization of assets.
Ethereum is a suitable and well-established blockchain that supports this agenda. It has notable market dominance as the King of altcoins. Therefore, Trump could be betting on its huge infrastructure with confidence that it will reshape finance and politics in the future.
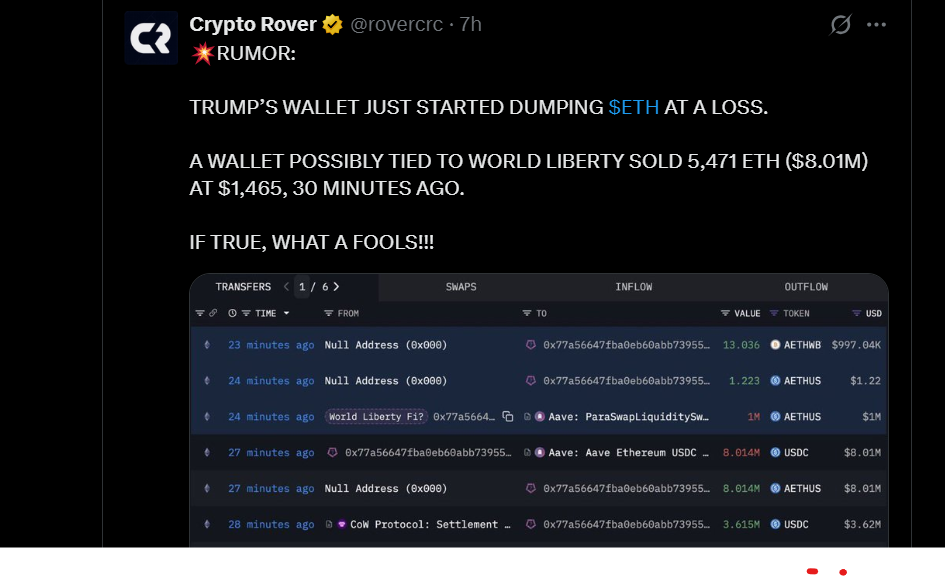
Speculation has it that Donald Trump’s DeFi project, World Liberty Financial, has offloaded its ETH wallets as Ethereum crashes.
Ethereum has hit a 2-year low price and a 58.86% drop since the beginning of 2025. The recent price crash has left major institutions dumping their ETH as open interest decreases.
According to Crypto Rover on X (formerly Twitter), a wallet supposedly belonging to Donald Trump, World Liberty Financial has dumped its ETH at a loss.
Source: X
What’s next for ETH?
While the market crash punishes ETH hard, some analysts believe the King of altcoins could be brewing its rebound. Some have argued that it’s time to buy ETH at 2018 prices. ETH’s derivatives data, Total Value Locked (TVL), and whale activity hint at a strong foundation. The altcoin could be down, but not entirely out in the long run.
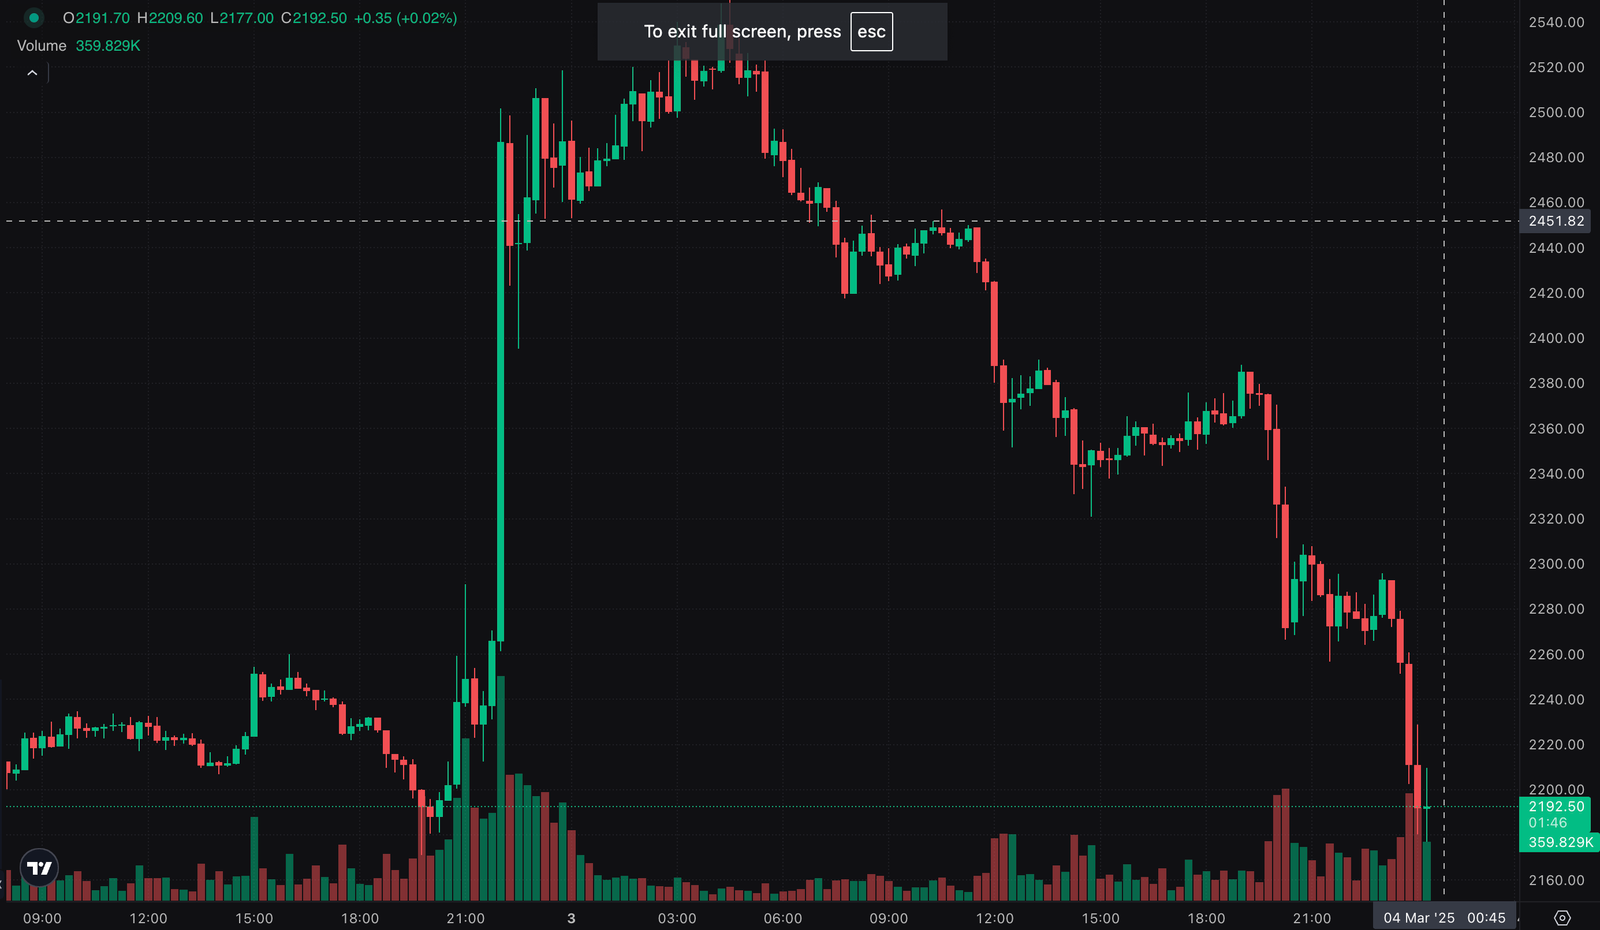
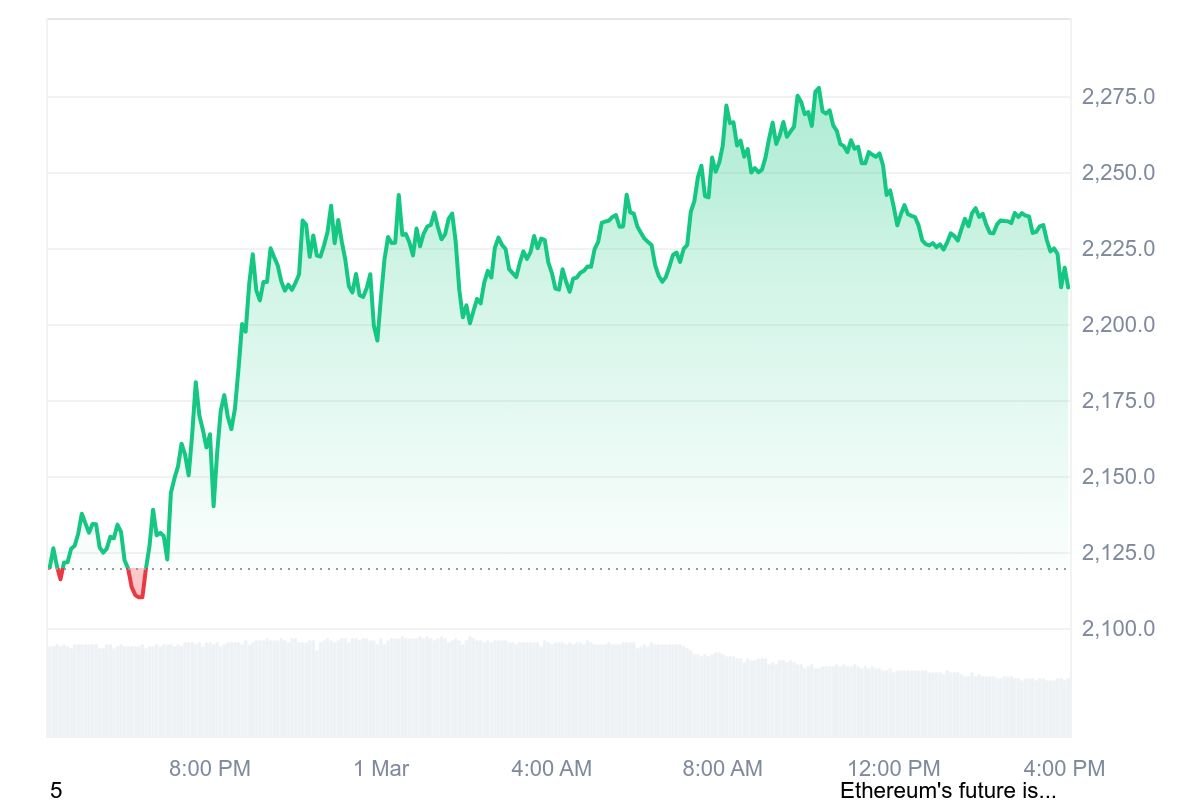
Ethereum (ETH/USD) is currently trading around $2,280, consolidating within a critical range. The price action suggests a potential breakout or breakdown scenario, depending on key support and resistance levels. Market participants should closely monitor these areas as they will define the next directional move for ETH.
Traders looking for ETH trading signals should keep a close eye on these levels.
ETH Trading Signal: Key Support and Resistance Levels
Immediate Support: $2,170 (Critical Level to Watch for ETH Trading Signal)
The $2,170 support zone is a key level where buyers have previously stepped in to prevent further declines. If ETH breaks and sustains below $2,170, it could signal a bearish move, triggering a deeper correction toward the next support.
• A breakdown below $2,170 would indicate increasing selling pressure, potentially signaling a further decline.
• If Ethereum holds above this level, it could stabilize and attempt a reversal toward higher price zones, offering a potential bullish ETH trading signal.
Major Support Levels: $2,050 and $1,910
If Ethereum fails to hold $2,170, the next critical support comes at $2,050, which aligns with previous accumulation areas. This level is crucial for maintaining bullish sentiment in the mid-term.
• A move below $2,050 could open the door for further downside, targeting $1,910, a historically strong demand zone.
• If ETH approaches $1,910 and establishes it as a *support zone, buyers may step in to defend this level, potentially leading to a rebound. However, if buying interest remains weak and ETH *fails to hold $1,910, the next downside target could be $1,700, signaling further bearish momentum and a negative ETH trading signal.
Immediate Resistance: $2,547 (Breakout Zone)
On the upside, $2,547 is the key resistance Ethereum needs to clear for a bullish continuation. This level has acted as a strong supply zone in recent price action, offering a crucial ETH trading signal for breakout traders.
• A breakout above $2,547 could confirm a trend reversal and shift momentum in favor of the bulls, providing a strong bullish ETH trading signal.
• Traders should watch for volume confirmation to validate the breakout.
Major Resistance: $2,860 (Upside Target for ETH Trading Signal)
If Ethereum surpasses $2,547, the next major target is $2,860, a crucial resistance level that aligns with previous swing highs.
• A move above $2,860 would strengthen the bullish case and could pave the way for a test of $3,000, a strong psychological level.
• Price action around this area will determine whether ETH can continue its upward trajectory, providing a potential ETH trading signal for further bullish movements.
Technical Indicators & Market Sentiment for ETH Trading Signal
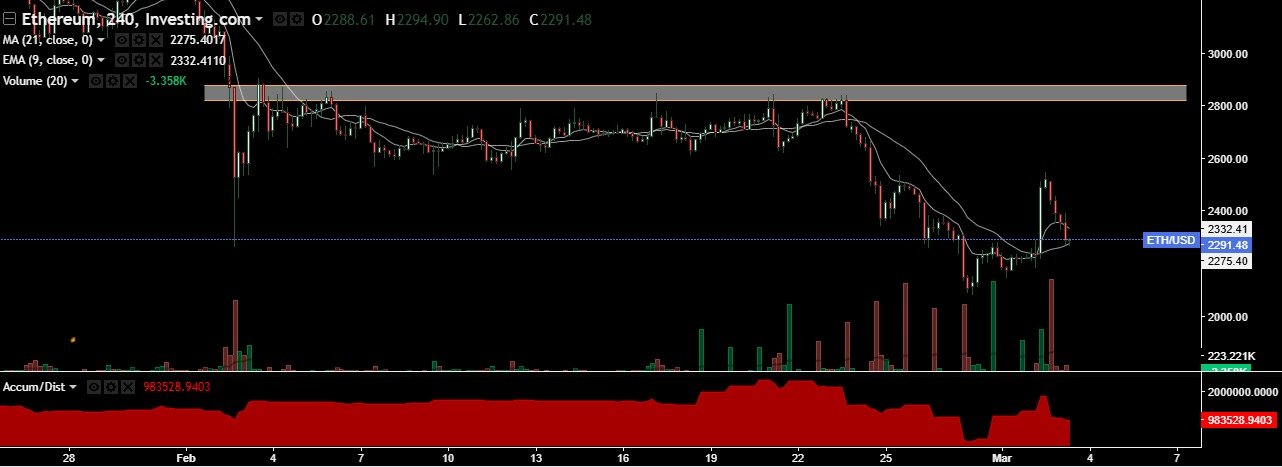
Moving Averages (EMA & MA):
• ETH is currently trading near the 9-period EMA and 21-period MA, indicating a neutral to slightly bearish short-term outlook.
• A break above the moving averages could reinforce a bullish recovery, signaling a potential ETH trading signal for long positions.
Volume & Market Strength:
• Trading volume has seen fluctuations, indicating uncertainty among traders.
• If ETH experiences a volume surge near key levels, it could confirm the next major move, offering a reliable ETH trading signal.
Accumulation/Distribution Indicator:
• The Accum/Dist indicator shows mixed sentiment, suggesting a battle between bulls and bears.
• A rise in accumulation could indicate increasing buying interest, signaling a potential bullish ETH trading signal.
Conclusion & ETH Trading Signal Strategy
Ethereum is at a crucial price zone, where price action around $2,170 and $2,547 will determine its next move. Traders looking for ETH trading signals should watch for breakout or breakdown patterns to adjust their positions accordingly.
Bullish Scenario: A breakout above $2,547 could push ETH toward $2,860 and possibly $3,000, providing a clear ETH trading signal for further upward movement.
Bearish Scenario: A break below $2,170 may lead to a decline toward $2,050, with a further drop to $1,910 if selling pressure increases, signaling a bearish ETH trading signal.
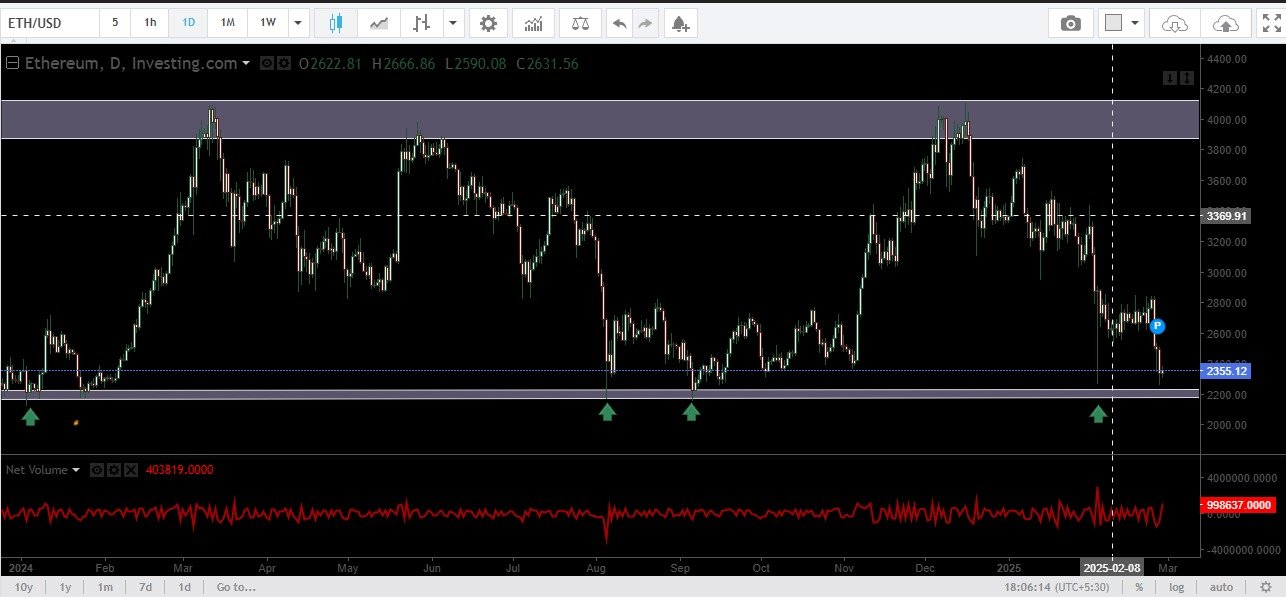
Ethereum (ETH) has been trading within a well-defined range, with significant attention on key support and resistance levels. Recently, ETH tested a critical demand zone around $2,140, a level that has historically provided strong support. Should this level fail to hold, the next major support zone lies between $1,750 and $1,700, which will be crucial for any potential price reversal.
Key Support and Resistance Levels:
Demand Zone: $2,140 – $2,300
ETH has repeatedly tested this support zone, with price action indicating that buyers are consistently stepping in at this level.
A strong break below this zone could indicate further downside, pushing ETH toward the next support area.
Next Support Zone: $1,750 – $1,700
If ETH fails to hold above $2,140, selling pressure may increase, sending ETH toward this critical support area.
This zone has previously acted as a strong reversal point and will be key to Ethereum’s price action in the coming weeks.
Price action indicates difficulty in breaking through this level, leading to sharp pullbacks in the past.
Technical Indicators and Market Sentiment:
Volume Analysis: Increased selling volume suggests a potential breakdown, with heightened risks of further downside.
Price Structure: Ethereum is currently forming lower highs and lower lows, which signals a bearish trend unless key support levels hold.
Historical Touch Points: The $2,140 demand zone has been tested multiple times, making it a crucial level to monitor for potential reversals or breakdowns.
Conclusion:
Ethereum’s price action is at a critical point. The $2,140 level is pivotal for determining the next direction of ETH. A strong hold above this zone could lead to a potential rally toward $2,600 and beyond. However, a breakdown below $2,140 could push ETH toward the $1,750 – $1,700 support zone. Traders and investors should monitor volume and price movements closely to gauge Ethereum’s next move.