SUI Flashes Signs of Strength amid Rising Investor Interest

1 0
Read Time:59 Second

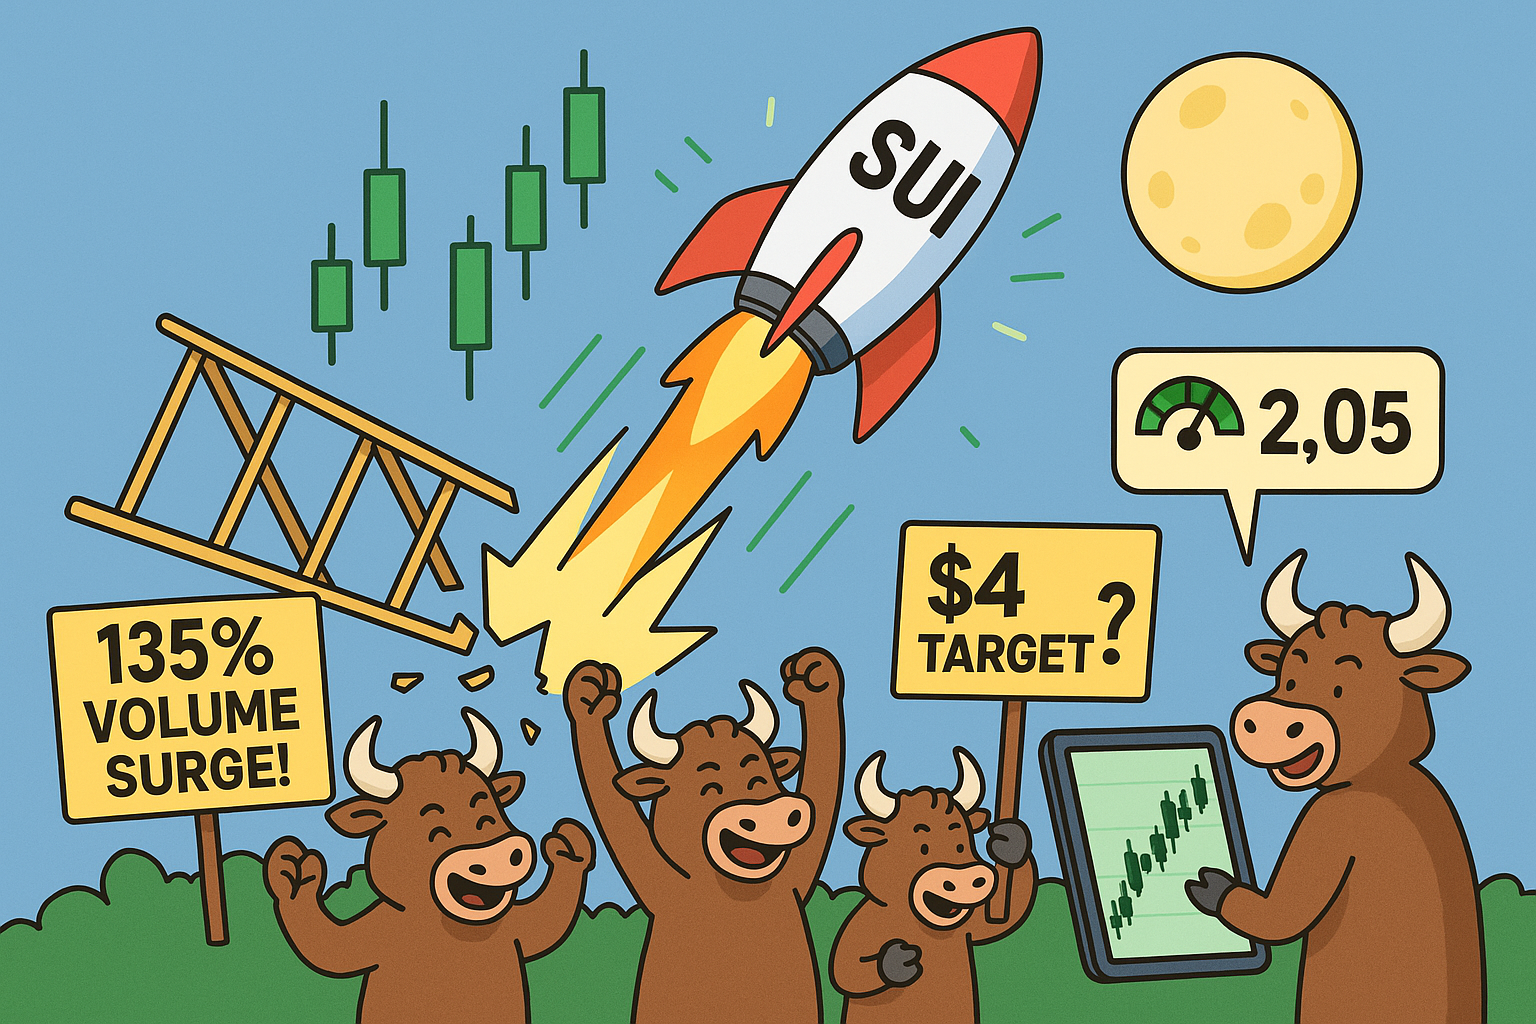
Sui has seen a 135% surge in 24-hour trading volume with an increased long-short ratio. Why is Sui pumping?


SUI has witnessed significant on-chain growth fueled by growing interest in its layer 1 blockchain capabilities. The coin has seen a 135% increase in trading volume, with its 24-hour long-to-short ratio rising to 2.05, at press time, per Coinalyze data. This suggests that the market saw more SUI buyers than Sellers in the past 24 hours, pumping the coin’s price by 5%.

So, why is SUI surging?

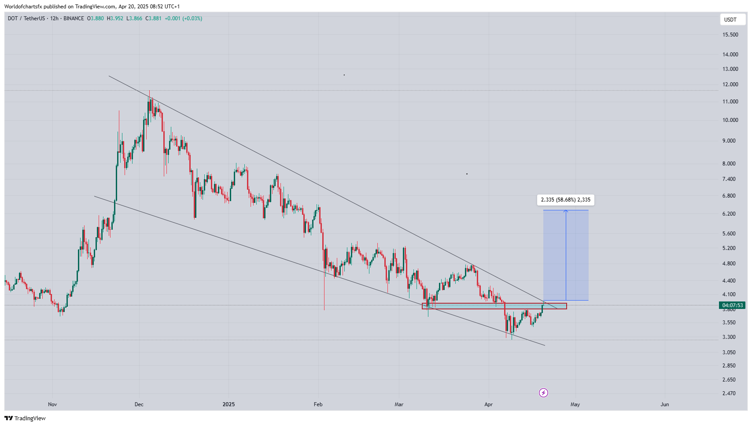
Looking at the charts, Sui has broken out of a descending wedge pattern on the daily chart. With the crypto market showing recovery after the trade tariff war, SUI’s breakout could mean a bull rally in the coming days. Technical analysis reveals $4 as the coin’s target in the coming days.


Source: X


Following the breakout, many investors are betting on SUI’s uptrend in the coming weeks. A surge in trading volume and buying pressure is indicative of accumulation. There has been heightened investor conviction in the network’s long-term growth.

Happy
0 0 %
Sad
0 0 %
Excited
0 0 %
Sleepy
0 0 %
Angry
0 0 %
Surprise
0 0 %

Bitcoin Reserves Across Exchanges Drops to Lowest-Ever

1 0
Read Time:47 Second

Bitcoin reserves have dropped to the lowest levels in history, suggesting a possible supply shock.


A recent market development in the BTC exchange supply has caught the market’s attention. Since the start of the year, Bitcoin supply on the exchanges has been on a steady decline, with the reserves hitting their lowest levels in history.

Decreased BTC reserves could signal a supply shock in the next few weeks as institutional and government interest rises.


Source: X

What does this mean for BTC?

As of 2025,  there has been large institutional Bitcoin buys as corporations such as Strategy leading the way. With potential accumulation by governments for treasury reserves, BTC exchange supply could decline further.

The market could face a supply shock that would see Bitcoin surge massively in the next few weeks driven by increased demand, increased disposable capital and whale accumulation after the trade tarrif war.

Happy
0 0 %
Sad
0 0 %
Excited
0 0 %
Sleepy
0 0 %
Angry
0 0 %
Surprise
0 0 %

Aptos APT Surges amid Rising Network Stablecoin Supply

1 0
Read Time:54 Second

Aptos has surged 4.02% with a high trading volume as the network’s stablecoin supply hits $1 billion.


Aptos, a layer 1 proof-of-stake (PoS) blockchain using smart contracts to boost web3 adoption, has seen its token APT surge 4.02% in the past 24 hours. APT has been trading inside a falling wedge pattern on the daily chart in Q1, 2025, and has broken out with a 25% surge in trading volume.


Source: X


Aptos was consolidating at around $5.11 as of this writing, per CoinMarketCap. Technical analysis suggests $6 as APT’s mid-term target while eyeing $9.7 following this breakout. According to Crypto King25, the total supply of natively minted USDC and USDC on the network has hit $1 billion.


Source: CoinMarketCap


Following a breakout and high stablecoin supply on the network, Aptos could be poised for an uptrend in the following weeks. Traders a closely watching APT’s next move following this breakout.

Happy
0 0 %
Sad
0 0 %
Excited
0 0 %
Sleepy
0 0 %
Angry
0 0 %
Surprise
0 0 %

Oversold Alert: Why Ethereum Could Be Rallying Soon

1 0
Read Time:1 Minute, 2 Second

Ethereum’s monthly Relative Strength Index(RSI) has dropped to its most oversold ever, and whales are accumulating the dip. So, are ETH bulls rallying soon?


Ethereum has seen its price drop significantly as of Q1 2025. Despite other altcoins rallying after the trade war freeze, the king of altcoins saw a price exhaustion in a recovery attempt. As of this writing, ETH is trading at $1583 per CoinMarketCap data.

Looking at Ethereum’s 8-hour chart, the coin has been consolidating inside a descending channel pattern in Q1, 2025.

Source: X


With the price dropping to a 2-year low, ETH’s Relative Strength Index(RSI) has dropped to 40. This suggests that the coin is oversold, leaving the price in trenches. The bulls have stepped in as Ethereum’s momentum and MACD(12,26) flash “buy”.

According to CryptoGoos on X (formerly Twitter):


WHALES HAVE BOUGHT OVER 200,000 $ETH IN THE LAST 3 DAYS. THEY’RE BUYING THE DIP!


With potential whale accumulation in the dip, ETH can break above the $1650 key resistance zone on its descending channel pattern. A confirmed breakout could see ETH rallying to $2800 in the next few weeks.


Happy
0 0 %
Sad
0 0 %
Excited
0 0 %
Sleepy
0 0 %
Angry
0 0 %
Surprise
0 0 %

Polkadot Flashes Breakout Signals-Is $4.8 the Next Target?

1 0
Read Time:55 Second

Polkadot is testing a key resistance level on its falling wedge with high trading volume, suggesting a strong breakout.


Polkadot, the blockchain network that bridges other blockchain networks, has caught the market’s attention following a 57.5% surge in trading volume in the past 24 hours. Per CoinMarketCap, DOT was trading at $3.82, a 2.47% price increase, as of press time.

DOT’s price has been trading inside a falling wedge pattern formation for the past 4 months. Looking at the 12-hour chart, the price is consolidating and testing the $4.10 key resistance zone on its descending resistance trendline.


Source: CoinMarketCap


Technical analysis by WorldofCharts suggests that $4.8 could be Polkadot’s next target following a confirmed successful breakout above its falling wedge formation.

With the MACD level (12,26) and short-term moving averages flashing “buy”, DOT could be geared up for an uptrend rally soon. One should watch out for the coin’s buying pressure and open interest at this level while the market awaits a confirmed breakout.

Happy
0 0 %
Sad
0 0 %
Excited
0 0 %
Sleepy
0 0 %
Angry
0 0 %
Surprise
0 0 %

Bitcoin Exchange Inflow Signals a Calm Moment-What’s next?

1 0
Read Time:49 Second

Bitcoin’s exchange inflow volume signals a slowdown that historically precedes strong price movements. 


Bitcoin inflows volume refers to the amount of BTC entering exchanges. A rise in exchange inflow signals potential selling pressure, while a low exchange inflow suggests accumulation. This indicator is critical in determining market entry points among investors. Recent data indicate a horizontal phase with no fluctuations, signalling a calm sentiment.

Source: X

According to analyst Ali Martinez on X (Formerly twitter):


For now, it’s signaling patience. We’re still waiting for the right opportunity to step in.


With the 30-day moving average trending horizontally, this could be a market cooldown with no aggressive exchange activity. Historically, this calmness is followed by a rally as the price consolidates in a range and defined entry points appear.

With rising institutional and government interest in BTC as a strategic reserve, this could be due in the next few months.

Happy
0 0 %
Sad
0 0 %
Excited
0 0 %
Sleepy
0 0 %
Angry
0 0 %
Surprise
0 0 %

Incoming Altseason? What does THIS Historical Setup Suggest?

1 0
Read Time:52 Second

Altcoin season hits its historical low levels while the global liquidity index (GLI) is on the rise, signalling new capital in the market. With altcoins gaining momentum, is altseason about to kick in?


Days after the tariff-fuelled crypto market crash, Bitcoin and altcoins have made notable recovery efforts. The altcoin sentiment has hit rock bottom on the charts. Despite this, the technical setup tells a historical story, one that has left the market wondering whether altcoins are on the verge of rebounding.


Source: Blockchaincenter.net


Looking at the chart, the market season is at level 18, a historical support level from which the shift to altcoin season sentiment begins. The global liquidity index is rising as countries print more money and implement pro-crypto policies.

As disposable capital becomes available due to the cooling trade war, investors could shift this liquidity into riskier assets.  Altcoins could be considered in a bid to diversify their crypto portfolios for higher returns.


Happy
0 0 %
Sad
0 0 %
Excited
0 0 %
Sleepy
0 0 %
Angry
0 0 %
Surprise
0 0 %

Cardano ADA Eyes 30% Price Surge in THIS Pattern-What’s next?

1 0
Read Time:49 Second

 Cardano’s price is consolidating inside a symmetrical triangle in the hourly chart. Analyst predicts a 30% upsurge in the next few days.


Over the past two weeks, ADA has been consolidating inside a symmetrical triangle on its hourly chart and is approaching a breakout. This follows a retest of its ascending trendline within this pattern formation. In the past 24 hours, the coin has seen its open interest rise 3.13% per Coinglass data.


Source: X


According to his technical analysis, analyst Ali Martinez predicts ADA could rally 30% following a retest of its ascending support trendline as the bulls step in to strengthen the uptrend momentum.

If ADA closes above $0.64 with high buying pressure, this is possible in the next few hours to days. However, one should watch out for any signs of exhaustion, where a decisive drop under $60 could lead to a further downside.

Happy
0 0 %
Sad
0 0 %
Excited
0 0 %
Sleepy
0 0 %
Angry
0 0 %
Surprise
0 0 %

Hyperliquid (HYPE) Holds Key Support- Is $36 Next on the Cards?

1 0
Read Time:55 Second

Hyperliquid surges 8.67% with a high trading volume after retesting and bouncing off a key support. Technical analysis hints at $36 as a long-term target.


Hyperliquid, the high-performance decentralized perpetuals exchange, has seen its token, HYPE, surge 8.67% in the past 24 hours, as of this writing. Per CoinMarketCap data, the coin’s trading volume has risen 28.41% following a retest and bounce-off at the $12-$13.5 key support zone on the daily chart.


Source: CoinMarketCap


According to technical analyst Solberg Invest, with the momentum building, traders are eyeing the $19-$27 key resistance zone in the mid-term while targeting $36 in the long-term.

Derivatives data by Coinglass signals heightened open interest (+10.12%) as HYPE’s Open Interest (OI) Weighted Funding Rate turns positive.

With prices fluctuating around the $16.7  level, hype could be geared up for a rally soon. One should watch for the coin’s buying volume, open interest, and Relative Strength Index(RSI) in the current setup to understand HYPE’s next moves.

Happy
0 0 %
Sad
0 0 %
Excited
0 0 %
Sleepy
0 0 %
Angry
0 0 %
Surprise
0 0 %

Whale Accumulation: THIS New Wallet Moved BTC Worth $118.3M!

1 0
Read Time:53 Second

A brand-new wallet has withdrawn 1,398 BTC valued at $118.3 million from the Kraken Exchange. Could this be another institutional buyer? 


Bitcoin is signalling a potential mid-term rally and has drawn significant institutional interest as of Q1 2025. As of press time, BTC is trading at $84,460 per CoinMarketCap data. Despite slight price fluctuations, Whale Insider has reported a mysterious wallet accumulating BTC, potentially anticipating a rally soon. According to the X post:


Newly created wallet withdraws 1,398 $BTC worth $118.3 million from Kraken exchange.

A look at the on-chain metrics reveals that this is a new wallet with no prior transaction history.


Source: X

So, what does this suggest?

As centralized exchange reserves drop due to large withdrawals (potential accumulation), BTC’s scarcity rises. As demand grows, Bitcoin surges as traders anticipate and speculate on future price increases.

While the withdrawal seems like another crypto transfer, timing and scale influence the market behaviour in the crypto space.

Happy
0 0 %
Sad
0 0 %
Excited
0 0 %
Sleepy
0 0 %
Angry
0 0 %
Surprise
0 0 %
Exit mobile version