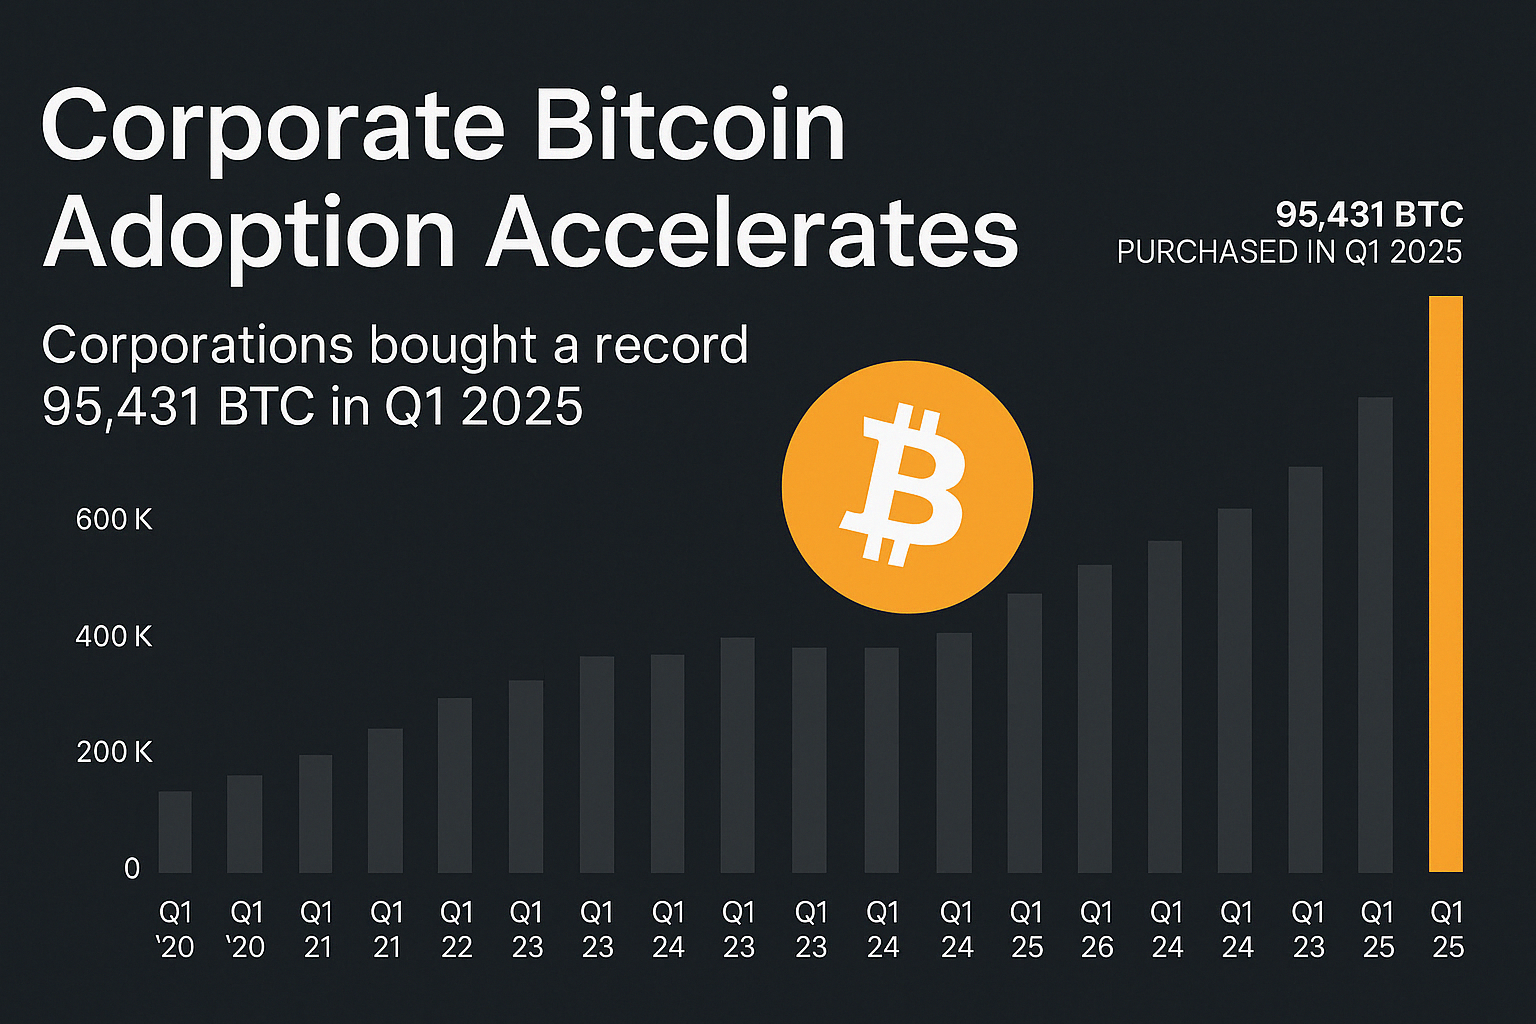
Corporate Bitcoin adoption is surging as companies buy 95,431 BTC in Q1, 2025, signalling heightened institutional confidence in crypto.
Bitcoin has found itself in the crypto spotlight on Tuesday, not only for hitting the $86k milestone, but also for the highest corporate acquisition in Q1 history over the years.
According to the latest report shared by Bitwise, institutions have recorded a total purchase of 95,431 BTC in Q1, 2025. Per the data, this marks BTC’s highest acquisition by large institutions in Q1 over the years.
Source: Bitwise
Bitcoin saw its first stages of Corporate interest during the COVID-19 pandemic period, following Strategy’s (formerly Microstrategy) 21,454 BTC purchase in August 2020 at $ 250 M. From treasury diversification to balance sheet reserves, BTC is spreading its wings in corporate finance.
Bitwise has noted this surge as a sign of increased investor confidence post-ETF approvals and clearer regulatory policies.
Michael Saylor announces that Strategy has bought another 3,459 Bitcoin, boosting the Company’s BTC stash to surpass half a million.
Strategy, formerly known as Microstrategy, is a U.S.-based business intelligence company that has shifted its focus to a bold Bitcoin investment vision since 2020. The company’s Executive Chairman and Co-founder, Michael Saylor, has announced its latest BTC purchase on the 13th of April. According to his X post ;
$MSTR has acquired 3,459 BTC for ~$285.8 million at ~$82,618 per bitcoin and has achieved BTC Yield of 11.4% YTD 2025. As of 4/13/2025, @Strategy holds 531,644 $BTC acquired for ~$35.92 billion at ~$67,556 per bitcoin.
He revealed that the company’s yield on BTC has hit 11.4% year to date. MicroStrategy became the first major company to adopt Bitcoin as a treasury reserve. Despite BTC’s volatility during market cycles, the company has kept “strong hands” on its coins, advocating a HODL Bitcoin investment approach.
Strategy’s Bold Bitcoin acquisition suggests rising corporate confidence and institutional adoption of Bitcoin as a digital asset in large portfolios.
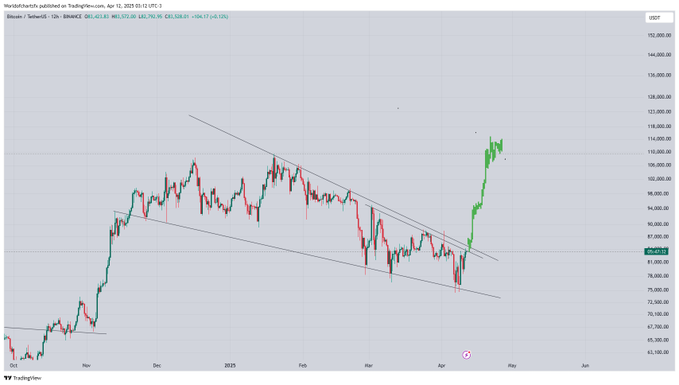
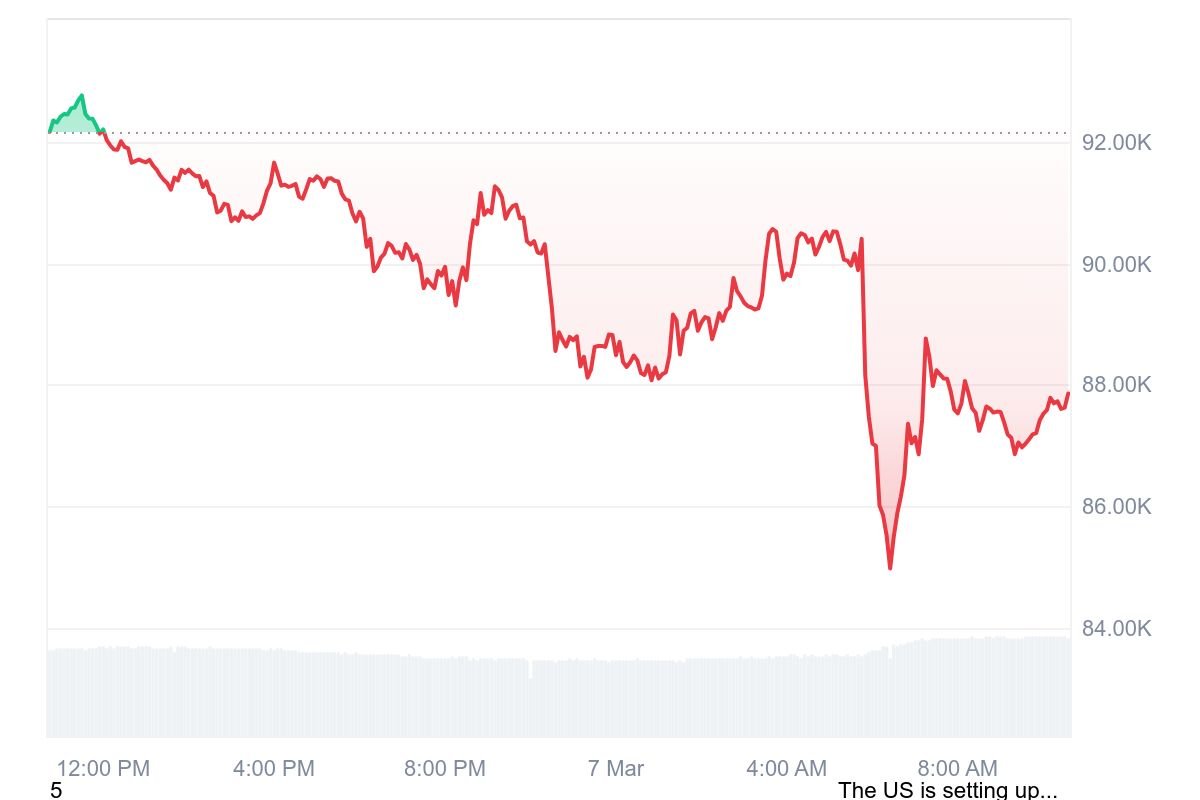
Bitcoin is recovering and currently testing the $83k-84k resistance zone. With the trade war cooling, is BTC’s rally on the cards?
Bitcoin has surged 2.07% in the past 24 hours signalling a strengthening bullish momentum. According to CoinMarketCap data, BTC was trading at $83,810 at the time of writing.
Following a freeze on trade tarrifs by U.S President Donald Trump, the stock market has been recovering. Similarly, Bitcoin bulls are pushing upwards as BTC tests the $83k-84k key resistance zone on the 12-hour chart.
Source: X
Based of Technical analysis by World of Charts on X( formerly Twitter), if Bitcoin bulls break past the $84k above this key resistance zone, the King of crypto could be poised for a notable uptrend.
Bitcoin’s RSI stands at 51, a neutral zone showing more buying potential. With more than 313 million in Exchange outflow, and 88% of holders in profit, the happy “strong hands” could be accumulating more. While new traders enter new positions, a breakout could lead to the next bull rally.
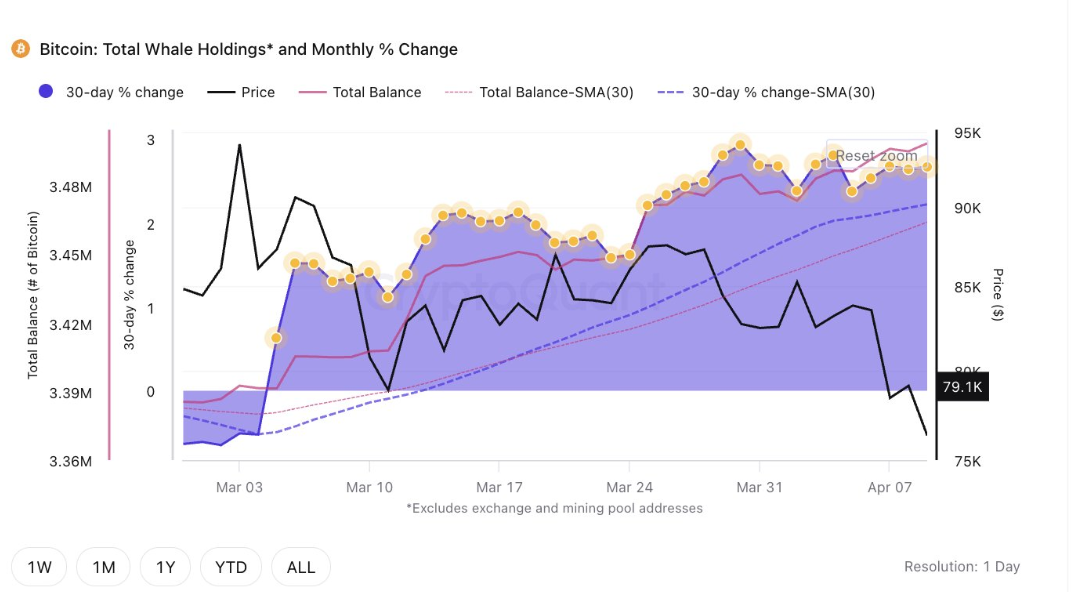
Large Investor Demand signals that Bitcoin is transitioning into a healthy investment and store of value, attracting more smart money.
A recent Bitcoin market update by Cryptoquant on X (formerly Twitter) has given valuable insights regarding Bitcoin as a strategic investment. According to the post, the demand for BTC from large investors has been on the rise despite market volatility in the past month.
Source: Coinglass
Excluding addresses by exchanges and mining firms, investors owning 1,000 -10,000 BTC have shown a steady increase. Despite the recent market crash affecting the crypto market, the whales seem long-sighted on Bitcoin as a maturing, healthy asset in their portfolios.
What does this mean?
When large investors keep their hands strong amid market volatility, this often signals a bullish market ahead. Such Whale behaviour suggests long-term investor conviction in BTC. As the market recovers, whale accumulation could strengthen BTC’s rally in the next few weeks.
The King of cryptocurrencies, Bitcoin, has found a strong support zone amid the current crypto market blood bath. BTC has faced significant price correction despite hitting $ 100k earlier this year. Per CoinMarketCap data, BTC was trading at $78.321k at press time.
With the global economy facing uncertainty and trade wars, traders wonder what’s next for Bitcoin as its price plunges.
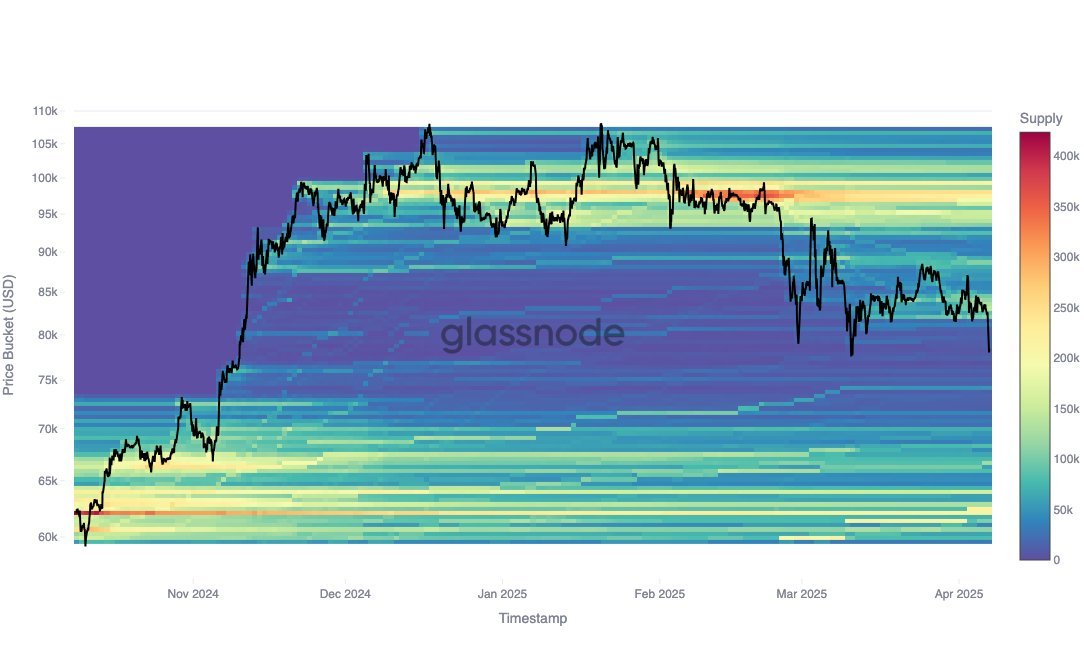
The $ 74k-$70k zone is a strong support cluster
According to Glassnode data, traders hold over 175,000 BTC in the $74k-$70k zone, with the strongest pocket (50,000 BTC) sitting at $ 74.2k. Holders have been inactive since March 10, suggesting a “wait-and-see” sentiment. The $69.9k is another lower support band of Bitcoin’s cost basis, holding 68,000 BTC.
Source: Glassnode
Is it a Cooling-off period?
The King of crypto is trading below the Short-term holder (STH) cost basis of $89k. On-chain metrics suggest a historical cooling-off zone in bull markets. Market activity has decreased, with few new buyers. Traders seem to be waiting for a shift towards bullish market sentiment.
Bitcoin (BTC) is currently facing a critical resistance zone between $84,000 and $84,500, where strong selling pressure has been observed. Over the past three days, BTC has been trading within a range of $77,000 to $84,500, indicating a Compression Phase before a breakout or breakdown.
This consolidation phase suggests that a major price movement is imminent.
Bitcoin Price Analysis: Consolidation & Resistance Zones
Bitcoin is currently experiencing a strong supply zone around the $84,000 – $84,500 resistance level. If BTC manages to break and sustain above $86,000, it could trigger a bullish rally towards $90,000 and beyond. However, failure to break this level may lead to further consolidation or downside movement.
Support Levels:
$79,000 – $80,000: Currently acting as a key support zone.
$77,500: If BTC breaks below this level, further downside is expected.
$73,000 – $71,000: The next major support zone if bearish momentum intensifies.
Resistance Levels:
$84,000 – $84,500: Immediate resistance with strong selling pressure.
$86,000: A crucial breakout level; sustained price action above this could lead to a bullish trend.
$90,000: A potential price target if BTC successfully clears the $86,000 and sustains above in higher timeframe, then the price will reach 90k.
Market Outlook & Potential Price Movement:
Bearish Scenario: If BTC fails to hold the $79,000 – $80,000 support zone, and breaks below $77,500, the price could decline further toward $73,000 – $71,000.
Bullish Scenario: If BTC breaks above $86,000 and closes above this level on higher timeframes, bullish momentum could take BTC toward the $90,000 mark, attracting further buyer interest.
Final thoughts:
Bitcoin is consolidating between $77,000 and $84,500, indicating a Compression Phase before a breakout or breakdown. Traders should closely monitor the $86,000 resistance level for potential bullish confirmation or watch for a breakdown below $77,500 for a bearish move. With increased volatility expected, strategic risk management is crucial for both short-term and long-term traders.
Disclaimer: This analysis is for informational purposes only and should not be considered financial advice. Always conduct your research before making investment decisions.
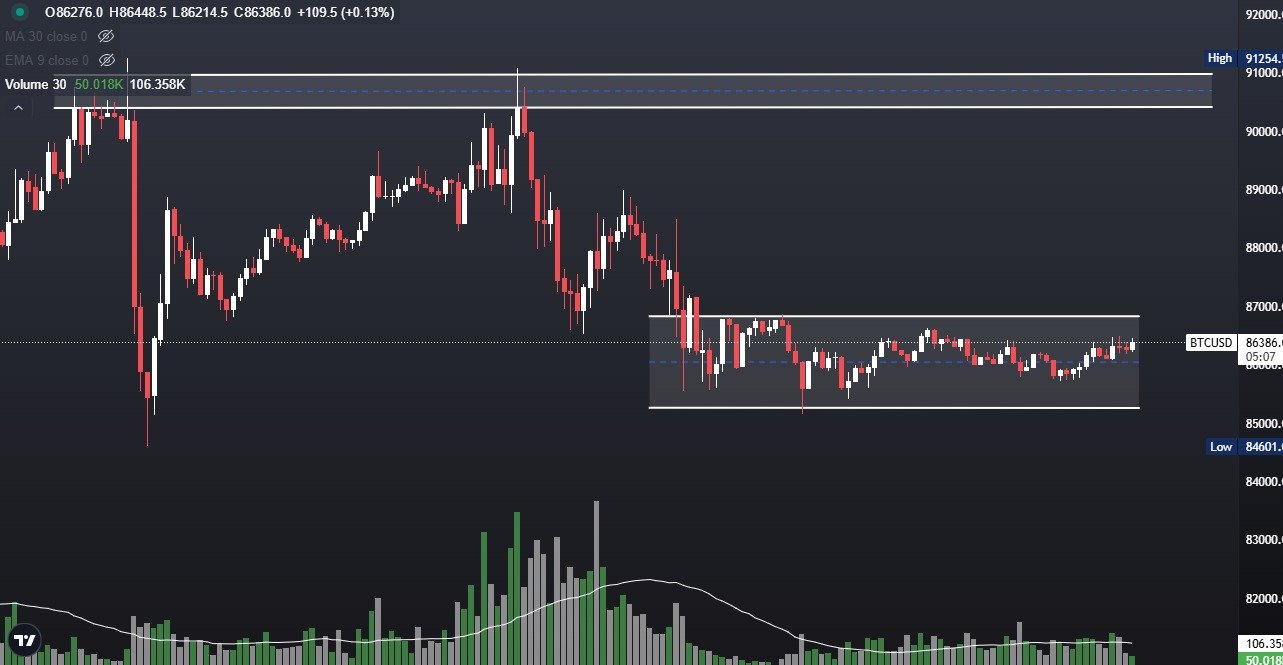
Bitcoin (BTC) is currently consolidating within a tight range of $85,200 – $86,900, indicating low volatility and reduced trading volume. This phase of consolidation suggests an impending breakout or breakdown, with price direction heavily dependent on volume confirmation.
Traders and investors should closely monitor key support and resistance levels to anticipate the next major move.
Bitcoin (BTC) Key Levels Analysis
Current Consolidation Zone: $85,200 – $86,900
BTC is trading in a narrow range, reflecting market indecision.
Volume remains low, signaling a lack of strong buying or selling pressure.
A breakout or breakdown from this range will determine the next directional move.
Upside Potential: Above $86,900
If BTC breaks above $87k with strong volume, it could trigger a move toward $90,000 – $91,000.
This level represents a key psychological resistance, where increased buying momentum may push the price higher.
Confirmation through high trading volume will be critical to sustain the move.
Downside Risk: Below $85k
A break below $85k could signal a bearish move, dragging BTC toward $82,000 – $83,000.
Selling pressure may intensify if the price fails to hold above this level.
Traders should monitor volume and market sentiment to gauge further downside risk.
Bitcoin Price Action and Trading Strategy
Bullish Scenario:
A confirmed breakout above $87k could push BTC toward the $90,000 – $91,000 resistance zone.
Traders may look for short-term long opportunities once BTC sustains above this level with strong volume support.
Bearish Scenario:
A breakdown below $85k may indicate a bearish continuation toward $82,000 – $83,000.
Short positions could be considered if BTC fails to regain strength above $85k after a breakdown.
Final Thoughts: Bitcoin Market Outlook
Bitcoin’s low volatility and tight range consolidation suggest an imminent breakout. The price action around $86,900 (resistance) and $85,200 (support) will determine BTC’s short-term direction. Traders should remain cautious and watch volume trends for confirmation before entering positions.
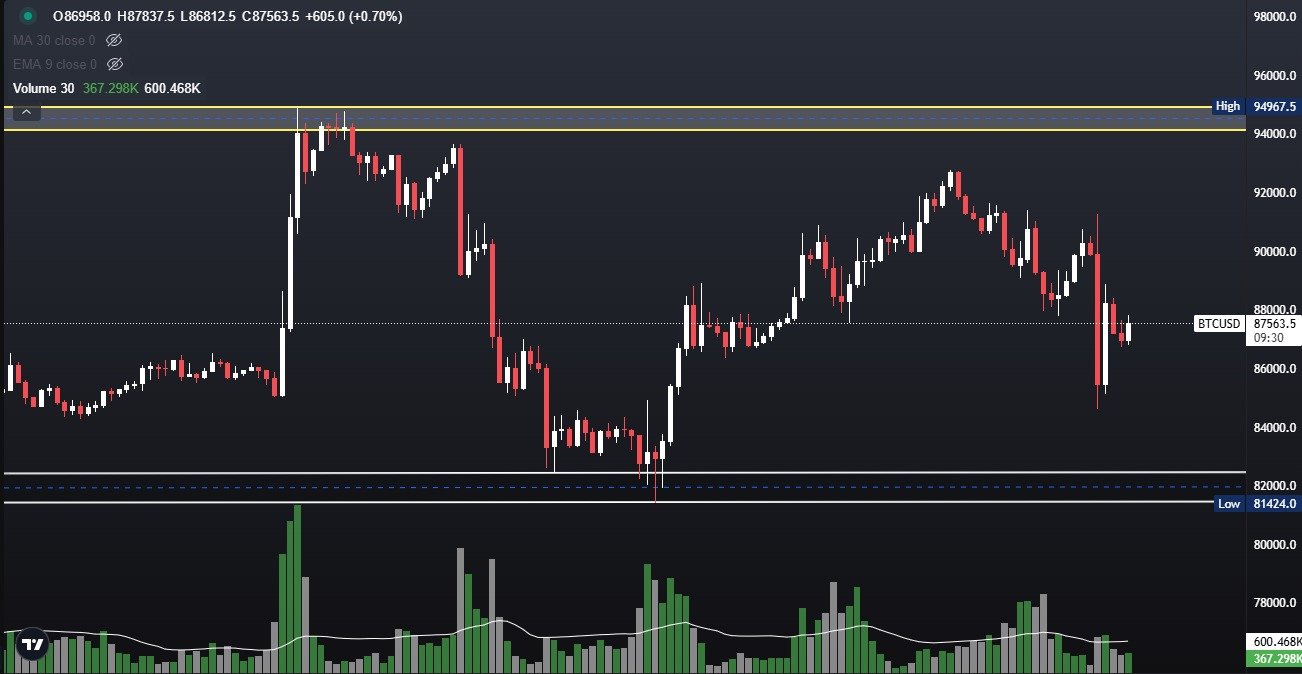
Bitcoin trading signal indicates that BTC remains under bearish pressure, with price action testing critical supply and demand zones that could determine the next major move. Traders should closely watch these levels for potential breakout or breakdown scenarios to make informed trading decisions.
Key Bitcoin Trading Levels:
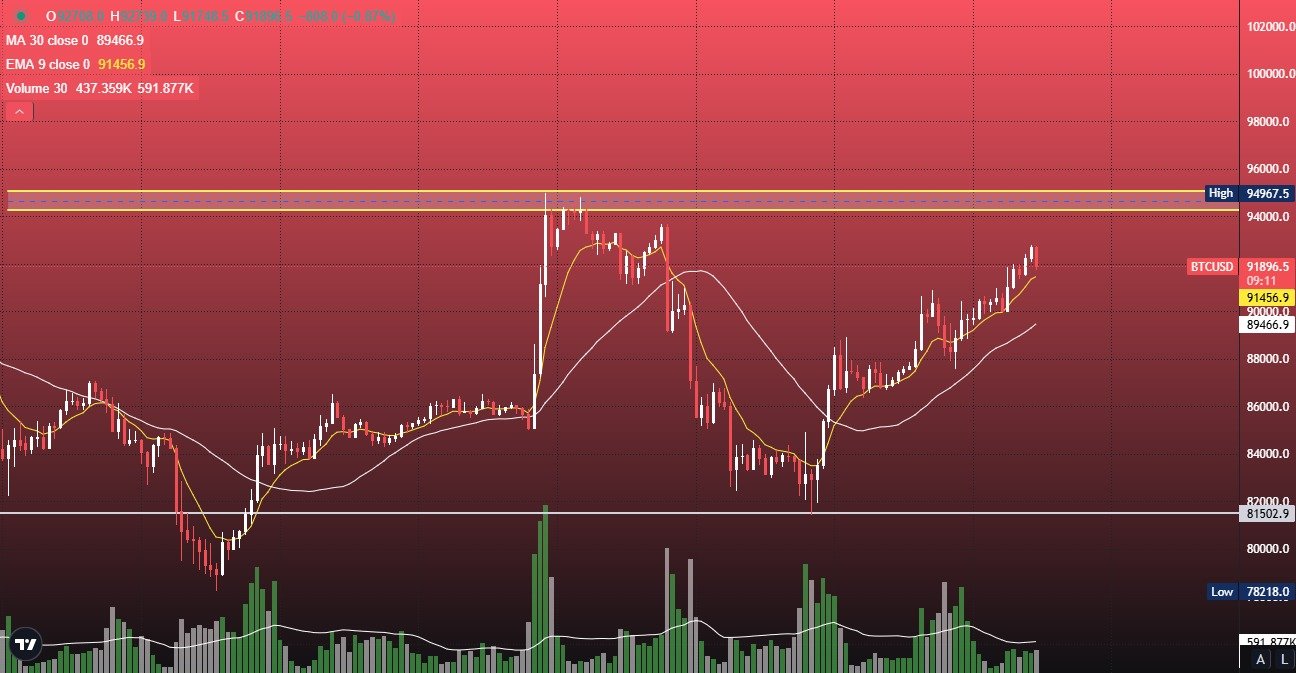
Supply Zone: $94,000 – $95,000
Demand Zone: $80,000 – $81,000
Upside Breakout Target: $100,000
Downside Breakdown Target: $72,000 – $73,000
Market Analysis:
Bitcoin is struggling near $87,563, failing to gain strong bullish momentum. The recent rejection at $94,967 highlights significant selling pressure.
A breakout above $95K, supported by strong volume, could fuel a short squeeze, pushing BTC toward the $100K psychological level.
A break below $80K and failure to hold $81,424 could trigger further downside, potentially leading BTC into the $72K – $73K demand zone.
Volume & Momentum Insights:
Volume analysis shows heightened activity from both institutional and retail traders, but the lack of sustained buying pressure suggests that sellers remain dominant.
Conclusion – Bitcoin Trading Signal Strategy:
BTC sits at a critical decision point, with $95K acting as a key resistance and $80K as a crucial support level.
A breakout above $95K may trigger a rally to $100K, while a breakdown below $80K could lead to further downside pressure.
Trading Strategy Recommendation:
Traders should closely monitor these critical levels, watch for volume confirmation, and adjust risk management strategies accordingly to capitalize on Bitcoin’s next major move.
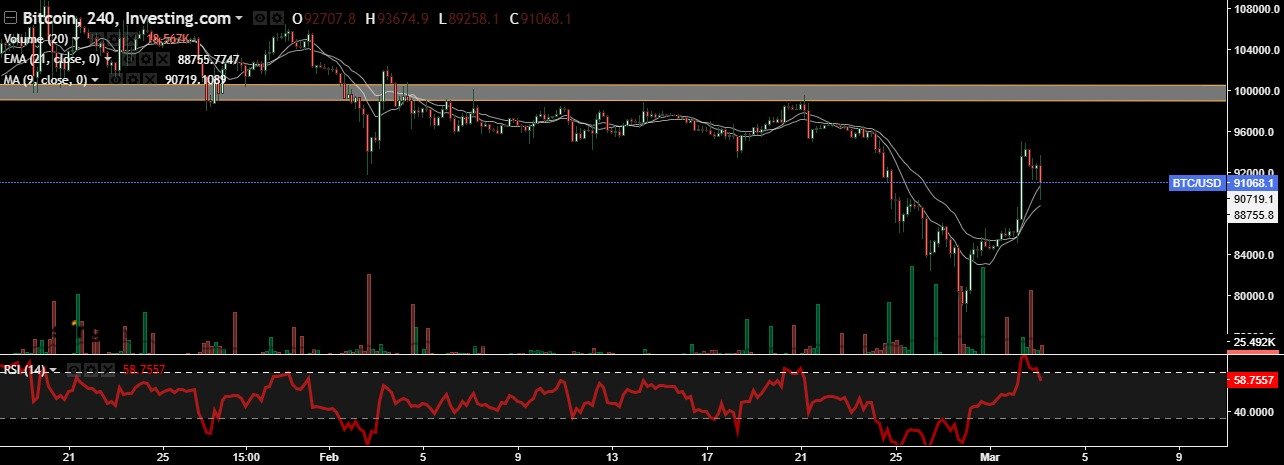
Bitcoin (BTC/USD) is showing signs of structural change, transitioning from lower lows to higher highs, indicating that momentum is shifting. The price has successfully held key support levels and is now testing a critical resistance zone at $94,000-$95,000.
A breakout above this level could fuel a rally toward $100,000, while a failure could trigger a pullback. Let’s analyze the key levels that will determine Bitcoin’s next move.
Bitcoin Trading Signal: Key Resistance and Support Zones
Bitcoin is currently testing the *$94,000-$95,000 resistance range, which has previously acted as a supply zone. If BTC successfully *breaks and sustains above this level, it could confirm further bullish momentum.
• A breakout above $95,000 with strong volume could push BTC toward the psychological level of $100,000.
• Traders should look for increasing volume and strong candle closes above this resistance for confirmation of a breakout.
Major Resistance: $100,000 (Psychological Barrier)
If BTC clears *$95,000, the next key resistance stands at $100,000, which is a *major psychological level and a likely target for profit-taking.
• A confirmed breakout above $100,000 would likely lead to its all-time high.
• Expect some volatility and possible retracements around this area before further continuation.
Immediate Support: $86,000 (Short-Term Level to Watch)
On the downside, $86,000 remains an important short-term support level. The market has previously respected this area, making it a crucial pivot point.
• If BTC remains above $86,000, it indicates accumulation and potential for another leg higher.
• A breakdown below $86,000 could trigger a pullback toward deeper support zones.
Major Support: $78,000 (Key Downside Level)
The previous higher low structure suggests that $78,000 is the most critical level to hold for bulls. This zone represents strong demand and has held as a significant reversal point in the past.
• If BTC breaks below $78,000, expect further downside movement toward the $72,000-$73,000 region.
• A decline to $72,000-$73,000 would confirm a deeper correction and a potential trend reversal.
Bitcoin Trading Signal: Conclusion & Strategy
Bitcoin is currently *testing a key resistance zone at $94,000-$95,000, and its ability to break above this level will determine its next move. *Holding above $89,000 keeps the uptrend intact, while a break below $78,000 could lead to a further drop.
Bullish Scenario: If BTC breaks and sustains above $95,000, it could rally toward $100,000. Bearish Scenario: A break below $78,000 could see BTC drop to $72,000-$73,000.
Traders should closely monitor volume confirmations and key support-resistance interactions to navigate BTC’s next major move. 🚀
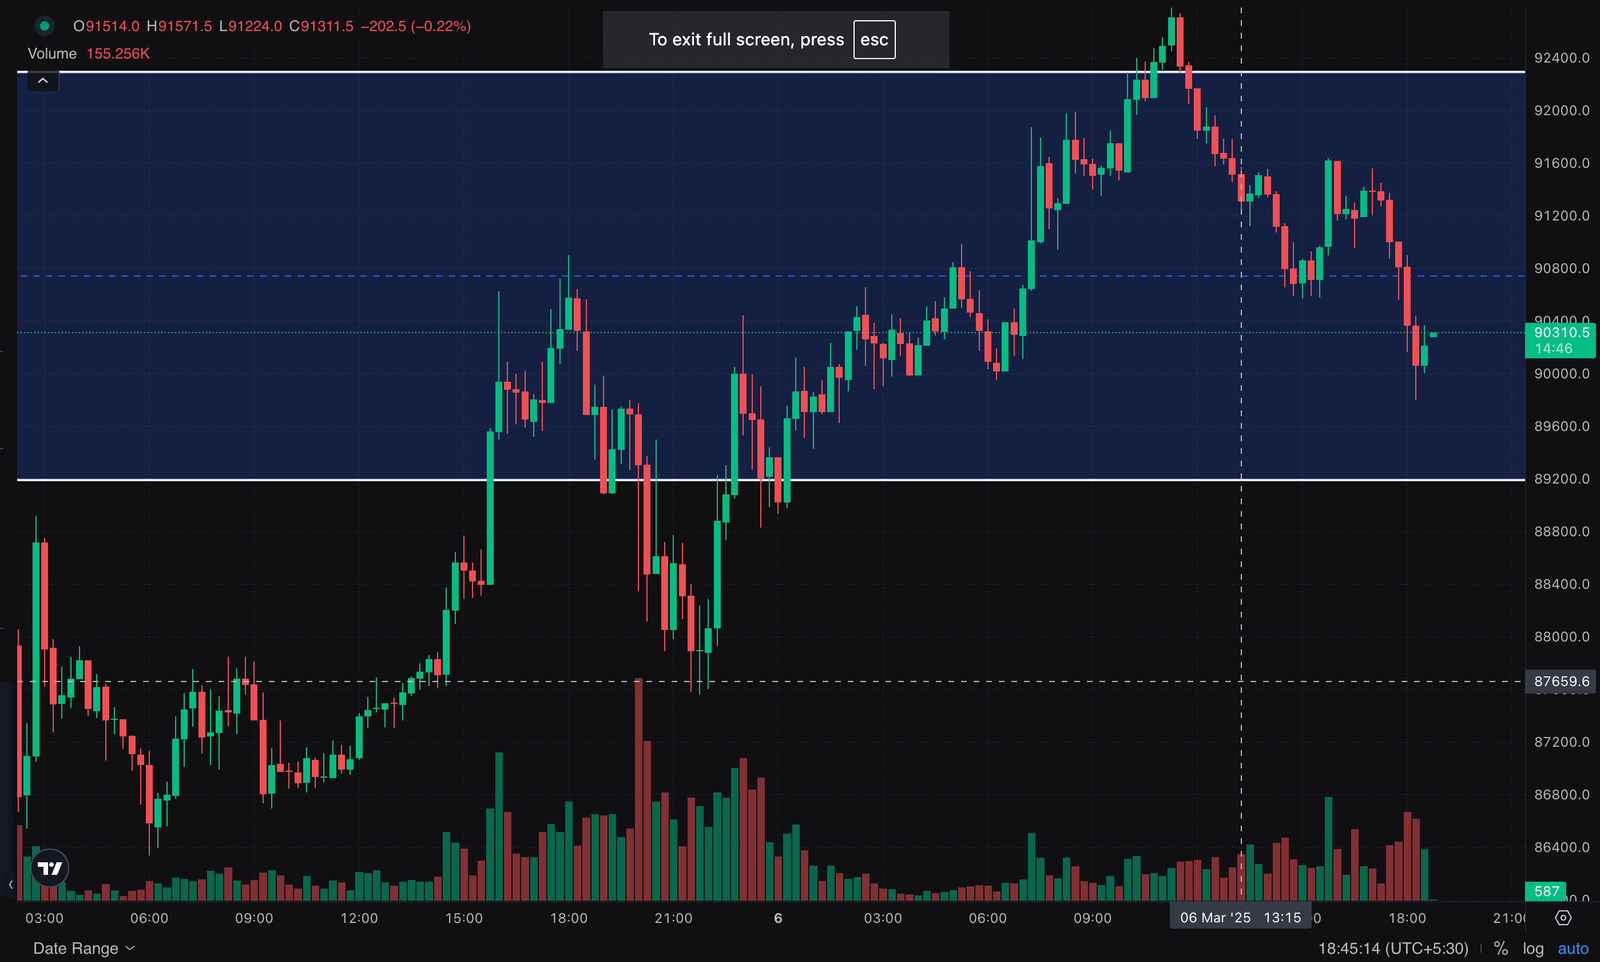
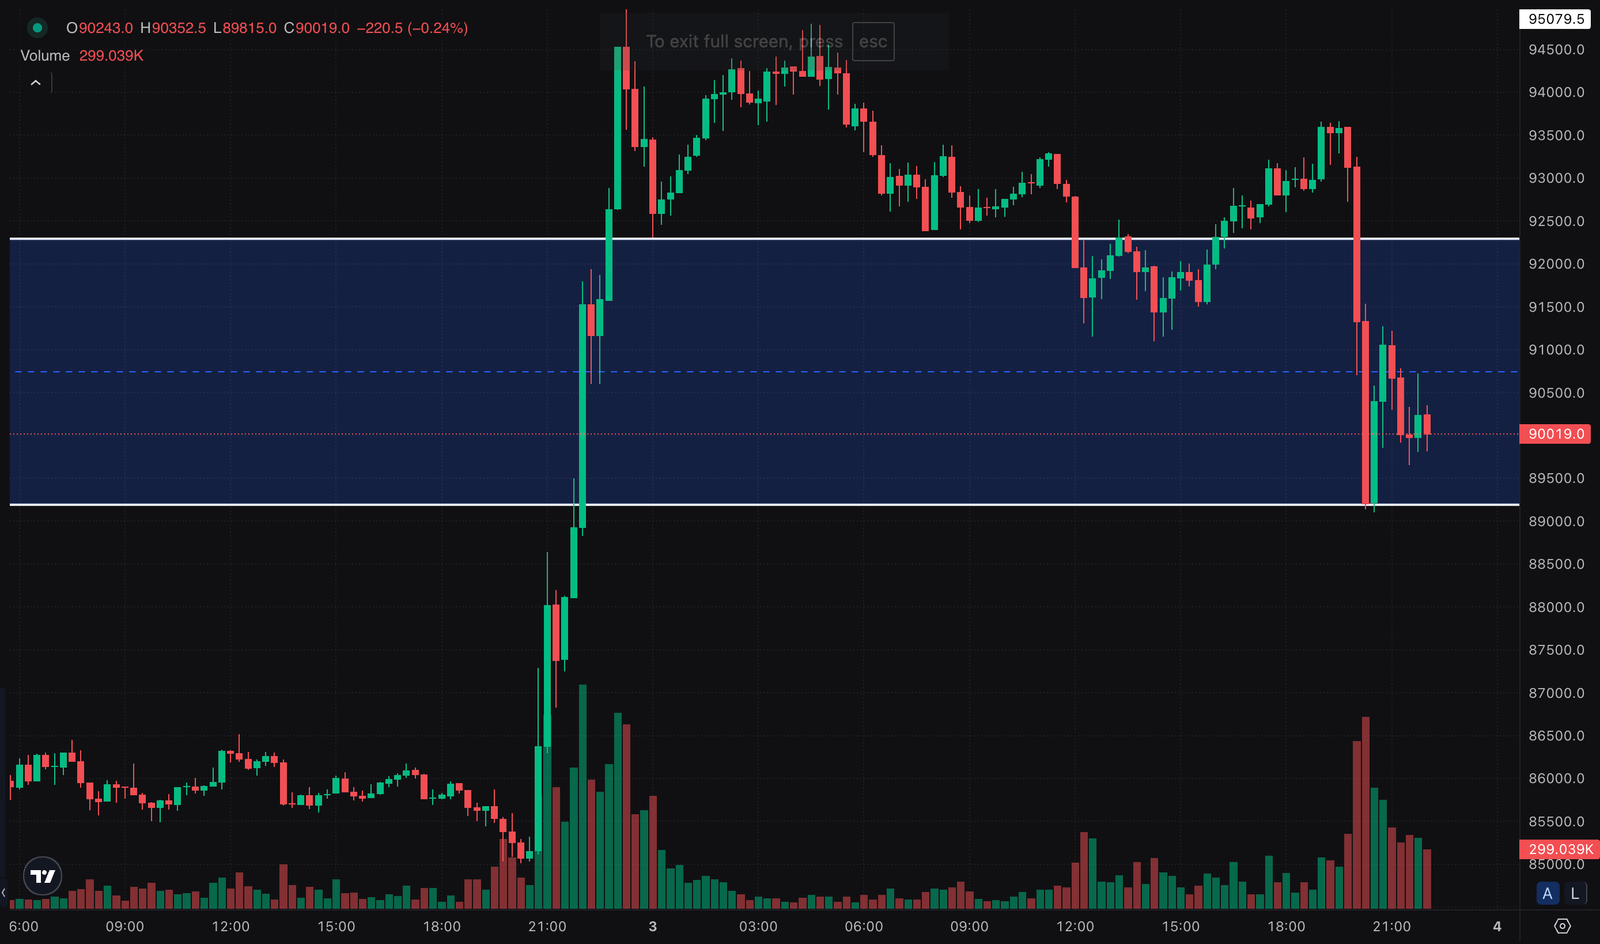
Bitcoin (BTC/USD) has been showing strong price action recently, attempting to recover from recent lows. As it navigates between crucial price zones, Bitcoin’s next directional move will largely depend on key resistance and support levels. Currently, Bitcoin is trading around $90,600, facing critical levels that traders should monitor for potential Bitcoin trading signals.
Key Bitcoin Trading Signal Levels: Support and Resistance Zones
The $95,000 level is a critical make-or-break level for Bitcoin. If Bitcoin breaks and sustains above this price point, it could signal a strong bullish breakout, leading to further gains. This resistance zone is where selling pressure has previously emerged, making it an important level to watch for potential bullish Bitcoin trading signals.
A decisive breakout above $95,000 will likely trigger increased buying activity, indicating a possible bullish trend continuation.
Traders should look for volume confirmation—if BTC surpasses this resistance with strong trading volume, it could be a signal of a bullish trend.
Major Resistance: $99,700 – $100,000 Psychological Barrier
Above $95,000, the next major resistance lies at $99,700, close to the psychological $100,000 level. Historically, this region has acted as both a strong resistance zone and a psychological barrier for Bitcoin.
Bitcoin could experience some profit-taking around this level before any potential continuation.
A clear breakout above $100,000 would likely trigger a bullish Bitcoin trading signal, opening the door for further upside momentum.
On the downside, $89,000 is an essential support level for Bitcoin. If Bitcoin holds above this level, it may indicate continued accumulation, offering a potential bullish Bitcoin trading signal for traders looking to capitalize on further upward momentum.
A bounce from $89,000 may signal ongoing buying interest and potential price recovery.
However, if Bitcoin breaks below this level, it could shift the market sentiment to bearish, potentially triggering a short-term bearish Bitcoin trading signal.
Major Support: $86,000 – Key Bearish Target
If Bitcoin fails to hold $89,000, the next major support level is at $86,000. This area has previously acted as a strong demand zone, where buyers have stepped in to defend Bitcoin from further declines.
A breakdown below $86,000 could signal the start of bearish momentum, opening the door for further downside.
The next potential support levels below $86,000 are in the $82,000-$80,000 range, which could be crucial for traders looking for bearish Bitcoin trading signals.
Conclusion & Bitcoin Trading Strategy
Bitcoin is currently hovering around critical make-or-break levels. Traders should closely monitor price action and volume confirmation at $95,000 and $89,000, as these levels will define the next major trend direction in the market.
Bullish Scenario: If Bitcoin breaks above $95,000, expect a run toward $99,000-$99,700. This would be a strong bullish Bitcoin trading signal.
Bearish Scenario: A break below $89,000 could send Bitcoin toward $86,000 and possibly lower, signaling a bearish Bitcoin trading signal.
By staying vigilant around these critical levels, traders can better time their entries and exits in the ever-evolving Bitcoin market.