

Bitcoin (BTC/USD) is showing signs of structural change, transitioning from lower lows to higher highs, indicating that momentum is shifting. The price has successfully held key support levels and is now testing a critical resistance zone at $94,000-$95,000.
A breakout above this level could fuel a rally toward $100,000, while a failure could trigger a pullback. Let’s analyze the key levels that will determine Bitcoin’s next move.
Bitcoin Trading Signal: Key Resistance and Support Zones
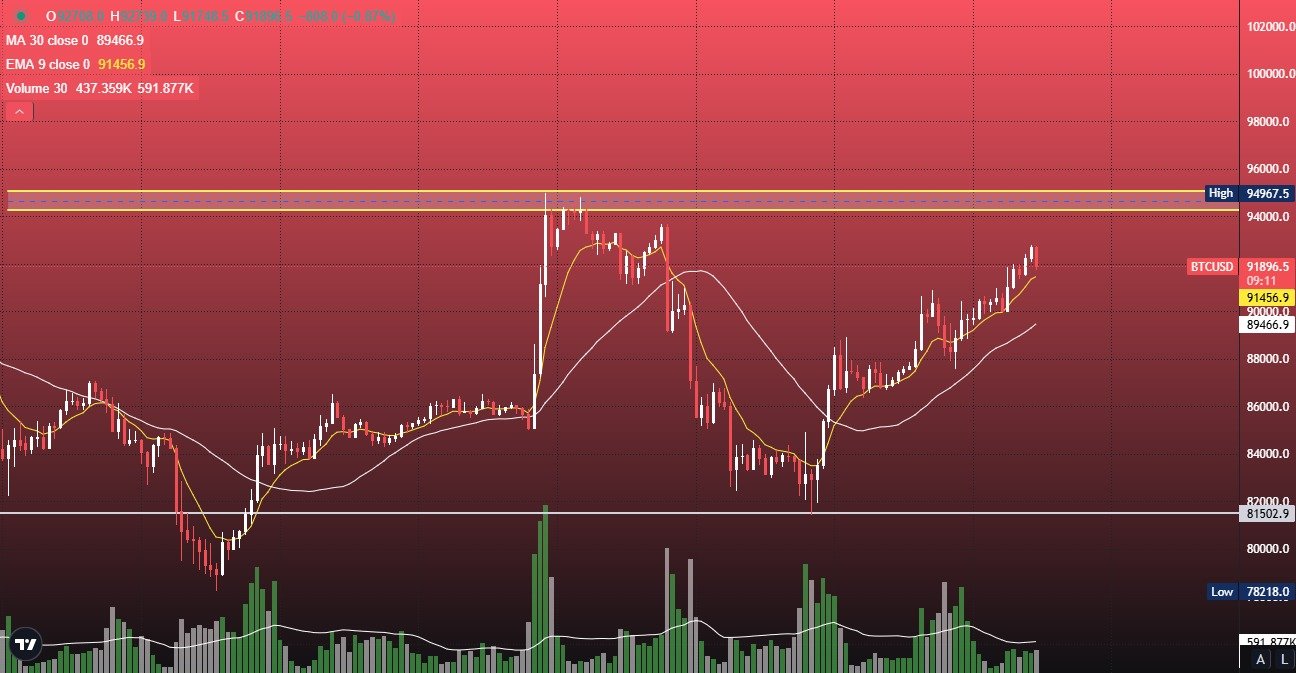

Immediate Resistance: $94,000-$95,000 (Key Breakout Zone)
Bitcoin is currently testing the *$94,000-$95,000 resistance range, which has previously acted as a supply zone. If BTC successfully *breaks and sustains above this level, it could confirm further bullish momentum.
• A breakout above $95,000 with strong volume could push BTC toward the psychological level of $100,000.
• Traders should look for increasing volume and strong candle closes above this resistance for confirmation of a breakout.
Major Resistance: $100,000 (Psychological Barrier)
If BTC clears *$95,000, the next key resistance stands at $100,000, which is a *major psychological level and a likely target for profit-taking.
• A confirmed breakout above $100,000 would likely lead to its all-time high.
• Expect some volatility and possible retracements around this area before further continuation.
Immediate Support: $86,000 (Short-Term Level to Watch)
On the downside, $86,000 remains an important short-term support level. The market has previously respected this area, making it a crucial pivot point.
• If BTC remains above $86,000, it indicates accumulation and potential for another leg higher.
• A breakdown below $86,000 could trigger a pullback toward deeper support zones.
Major Support: $78,000 (Key Downside Level)
The previous higher low structure suggests that $78,000 is the most critical level to hold for bulls. This zone represents strong demand and has held as a significant reversal point in the past.
• If BTC breaks below $78,000, expect further downside movement toward the $72,000-$73,000 region.
• A decline to $72,000-$73,000 would confirm a deeper correction and a potential trend reversal.
Bitcoin Trading Signal: Conclusion & Strategy
Bitcoin is currently *testing a key resistance zone at $94,000-$95,000, and its ability to break above this level will determine its next move. *Holding above $89,000 keeps the uptrend intact, while a break below $78,000 could lead to a further drop.
Bullish Scenario: If BTC breaks and sustains above $95,000, it could rally toward $100,000.
Bearish Scenario: A break below $78,000 could see BTC drop to $72,000-$73,000.
Traders should closely monitor volume confirmations and key support-resistance interactions to navigate BTC’s next major move. 🚀


Thanks for sharing. I read many of your blog posts, cool, your blog is very good. https://www.binance.com/ur/register?ref=SZSSS70P