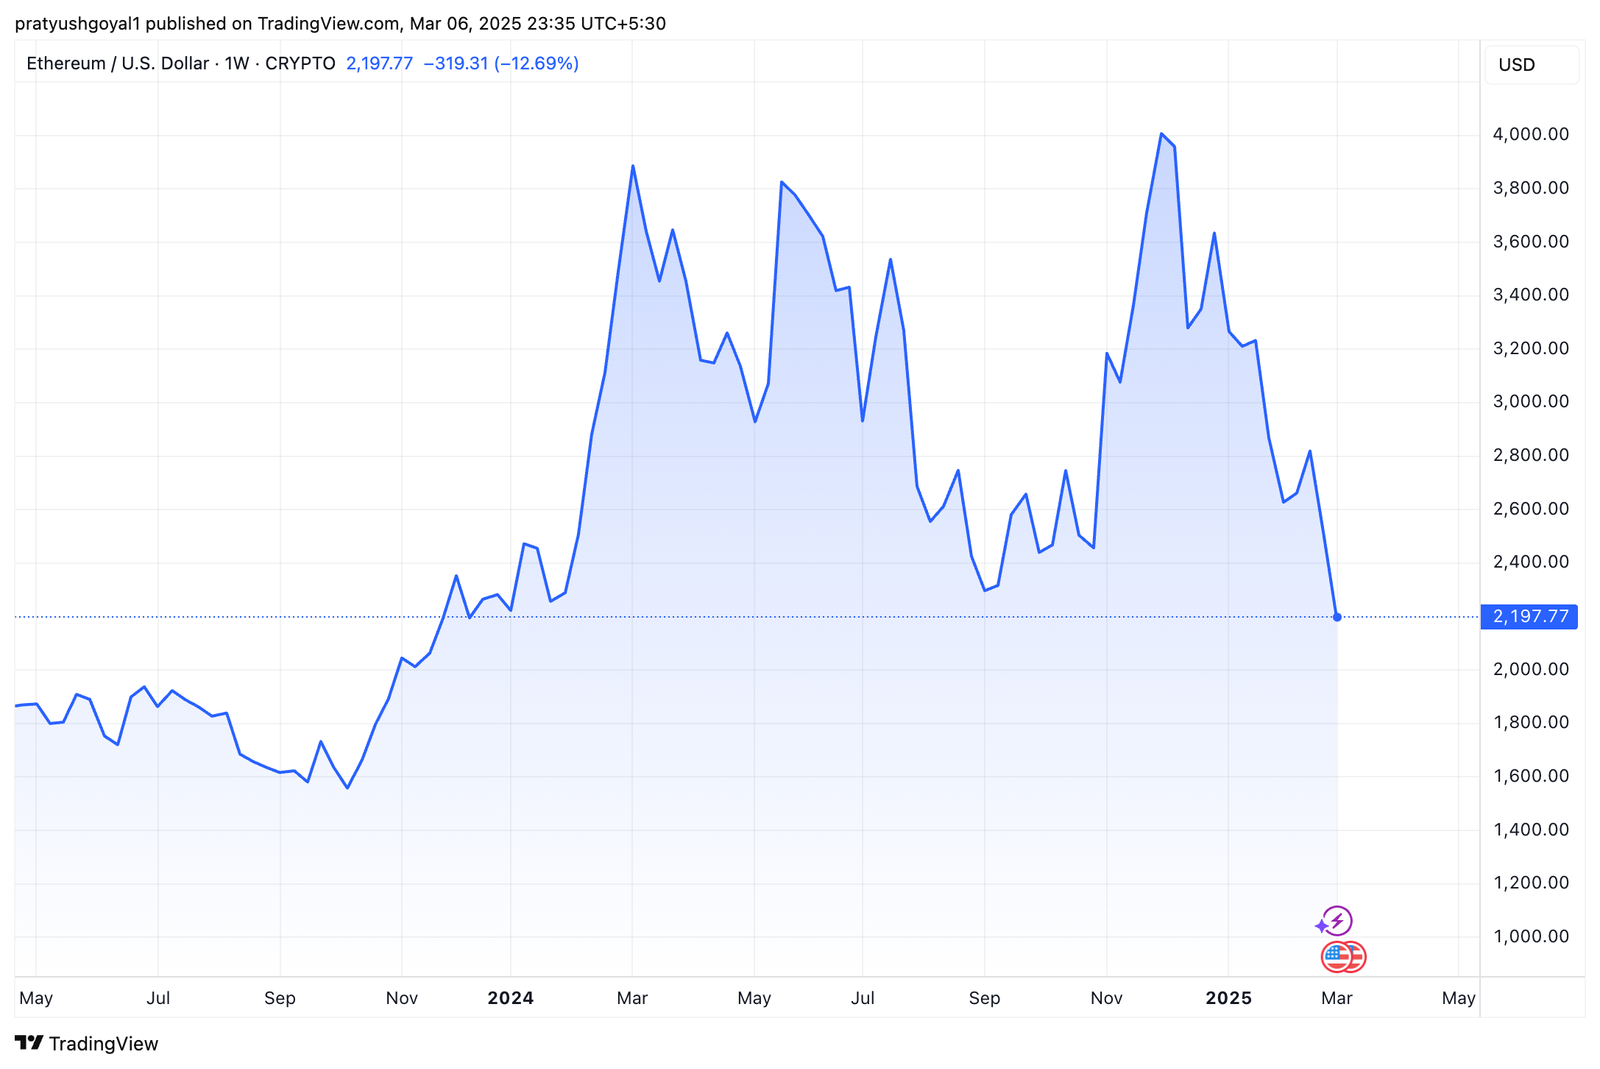
Ethereum (ETH/USD) has recently bounced from the key support level around $1,995, showing a potential recovery. However, price action remains uncertain, and traders should closely monitor critical support and resistance levels to anticipate the next move.
Date: 6 Mar 2025
Timeframe: (Assumed 4H or Daily Chart Based on Image)
Current Price: $2,245
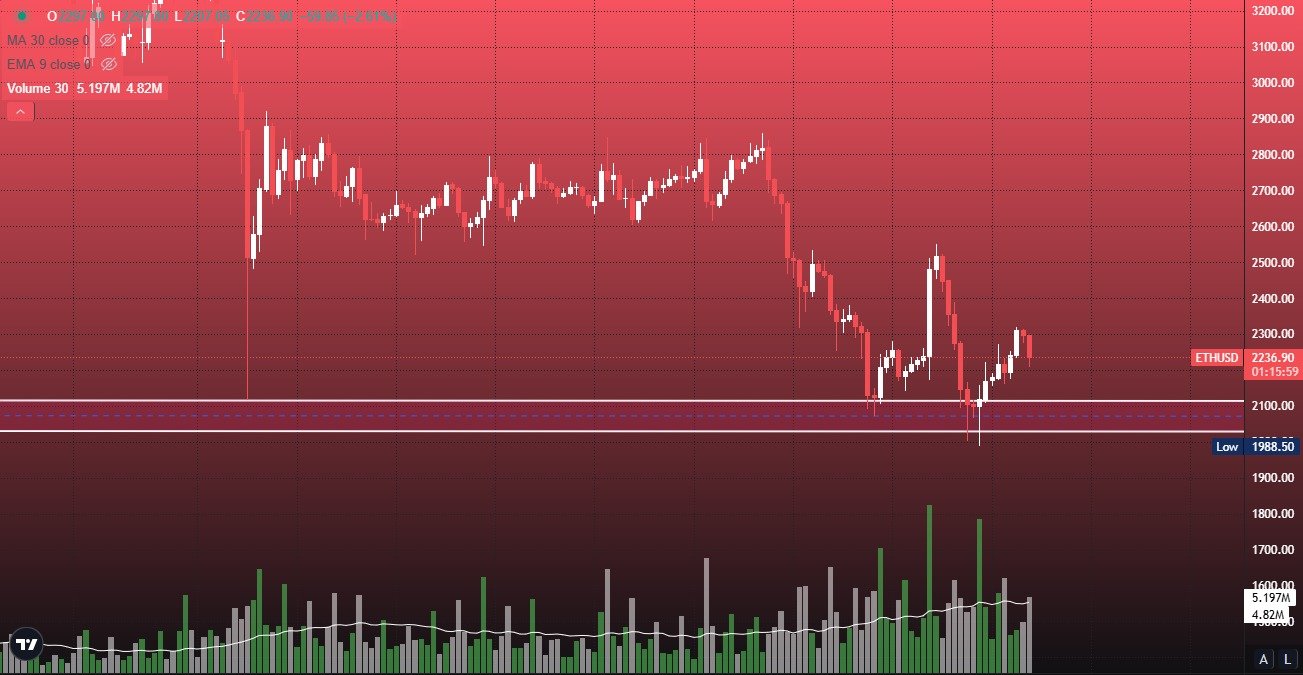
Support Levels: $1,995 – $1,990
Resistance Levels: $2,315 – $2,520
Key Technical Observations
1. Support & Resistance Levels
• Immediate Support: $1,990 – $1,995 (Recent bounce zone)
• Major Downside Target: $1,700 (If the $1,990 support breaks)
• Immediate Resistance: $2,315 (Key breakout level)
• Upside Target: $2,520 (If price breaks above $2,315)
2. Price Action Analysis
• The price has shown a strong bounce from $1,995, indicating potential short-term buying pressure.
• However, ETH remains in a downtrend, as seen from lower highs and lower lows.
• Bearish momentum is still dominant, indicating sellers are in control.
• A break below $1,990 could trigger another sell-off, potentially driving ETH to $1,700 as the next significant support level.
3. Volume & Momentum Indicators
• Volume Analysis:
- Green volume spikes indicate buying interest at lower levels.
- However, overall volume remains moderate, suggesting caution.
• Moving Averages: - The chart features 30-period MA and 9-period EMA, which are trending downward, confirming the bearish bias.
• Momentum Outlook: - If ETH sustains above $2,245, bullish momentum may push it towards $2,315.
- A failure to hold above this level increases the probability of another leg down.
ETH Trading Signal: Trade Scenarios & Strategy
Bullish Scenario (Breakout Above $2,315)
• If ETH breaks and closes above $2,315, it may trigger further upside momentum.
• Target: $2,520 (Major resistance level)
• Stop-Loss: Below $2,245 to minimize risk
Bearish Scenario (Break Below $1,990)
• A breakdown below $1,990 could confirm another bearish leg.
• Target: $1,700 (Key support level)
• Stop-Loss: Above $2,050
ETH Trading Signal: Conclusion
Ethereum is at a *critical inflection point, with a *range-bound structure between *$1,990 and $2,315. Traders should watch for a *breakout in either direction before taking decisive positions.
• Bullish Bias: If price sustains above $2,315, potential rally towards $2,520.
• Bearish Bias: If price breaks below $1,990, a decline towards $1,700 is likely.
Recommendation: Wait for a breakout confirmation before entering trades. Use proper risk management strategies to avoid unexpected volatility.


Your article helped me a lot, is there any more related content? Thanks!
Your article helped me a lot, is there any more related content? Thanks!