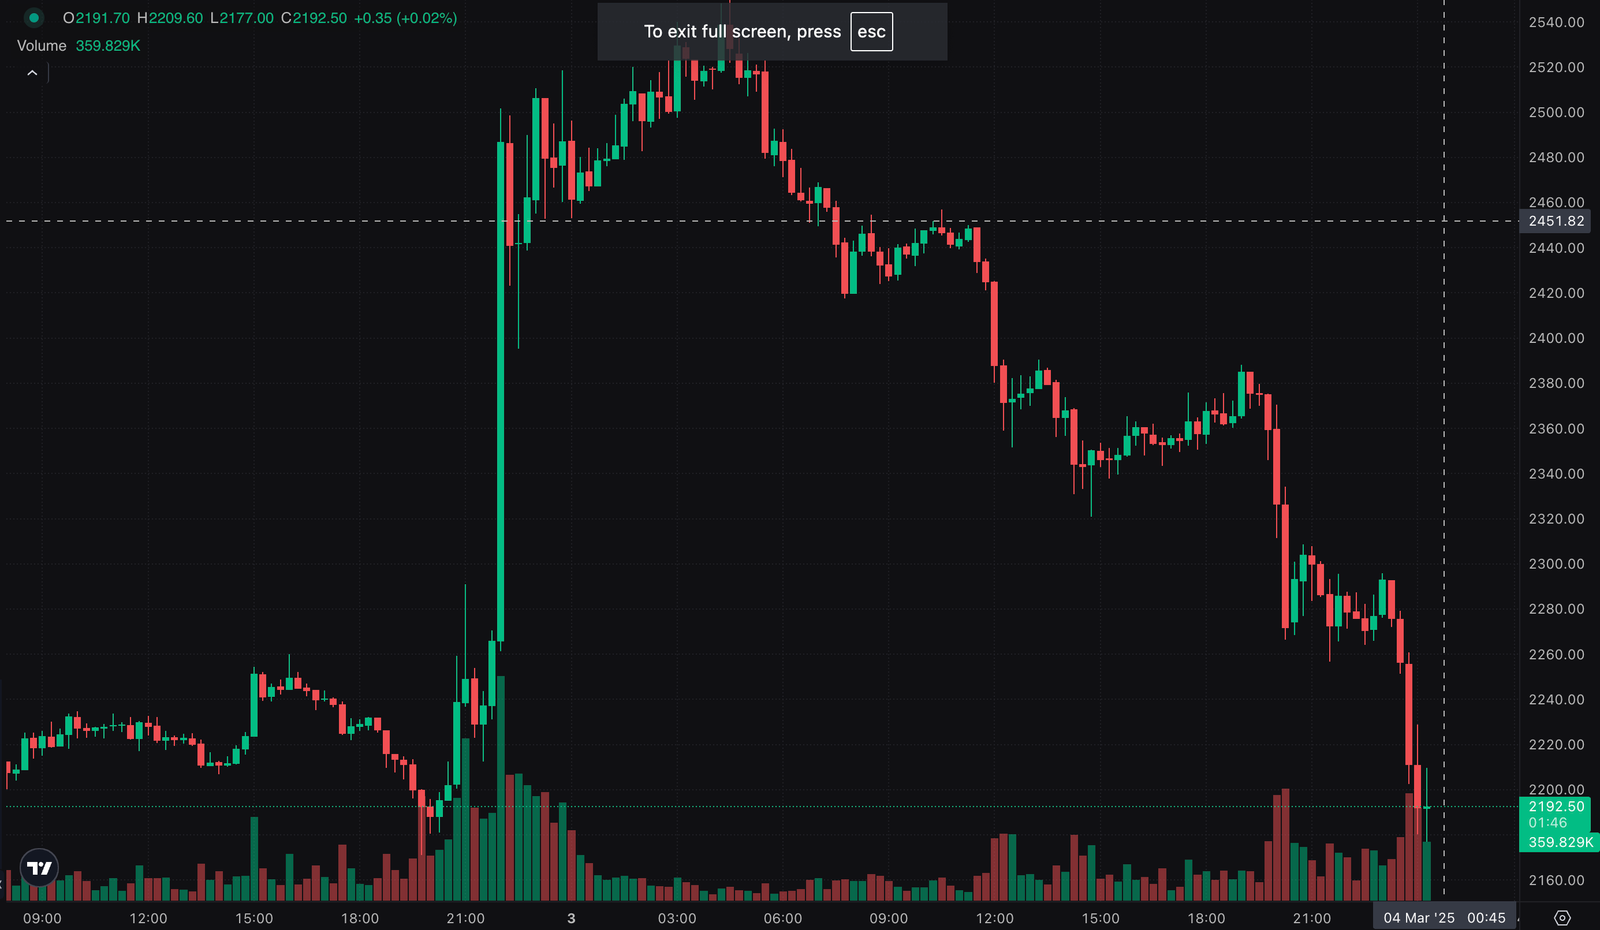
Ethereum (ETH/USD) is currently trading around $2,280, consolidating within a critical range. The price action suggests a potential breakout or breakdown scenario, depending on key support and resistance levels. Market participants should closely monitor these areas as they will define the next directional move for ETH.
Traders looking for ETH trading signals should keep a close eye on these levels.
ETH Trading Signal: Key Support and Resistance Levels
Immediate Support: $2,170 (Critical Level to Watch for ETH Trading Signal)
The $2,170 support zone is a key level where buyers have previously stepped in to prevent further declines. If ETH breaks and sustains below $2,170, it could signal a bearish move, triggering a deeper correction toward the next support.
• A breakdown below $2,170 would indicate increasing selling pressure, potentially signaling a further decline.
• If Ethereum holds above this level, it could stabilize and attempt a reversal toward higher price zones, offering a potential bullish ETH trading signal.
Major Support Levels: $2,050 and $1,910
If Ethereum fails to hold $2,170, the next critical support comes at $2,050, which aligns with previous accumulation areas. This level is crucial for maintaining bullish sentiment in the mid-term.
• A move below $2,050 could open the door for further downside, targeting $1,910, a historically strong demand zone.
• If ETH approaches $1,910 and establishes it as a *support zone, buyers may step in to defend this level, potentially leading to a rebound. However, if buying interest remains weak and ETH *fails to hold $1,910, the next downside target could be $1,700, signaling further bearish momentum and a negative ETH trading signal.
Immediate Resistance: $2,547 (Breakout Zone)
On the upside, $2,547 is the key resistance Ethereum needs to clear for a bullish continuation. This level has acted as a strong supply zone in recent price action, offering a crucial ETH trading signal for breakout traders.
• A breakout above $2,547 could confirm a trend reversal and shift momentum in favor of the bulls, providing a strong bullish ETH trading signal.
• Traders should watch for volume confirmation to validate the breakout.
Major Resistance: $2,860 (Upside Target for ETH Trading Signal)
If Ethereum surpasses $2,547, the next major target is $2,860, a crucial resistance level that aligns with previous swing highs.
• A move above $2,860 would strengthen the bullish case and could pave the way for a test of $3,000, a strong psychological level.
• Price action around this area will determine whether ETH can continue its upward trajectory, providing a potential ETH trading signal for further bullish movements.
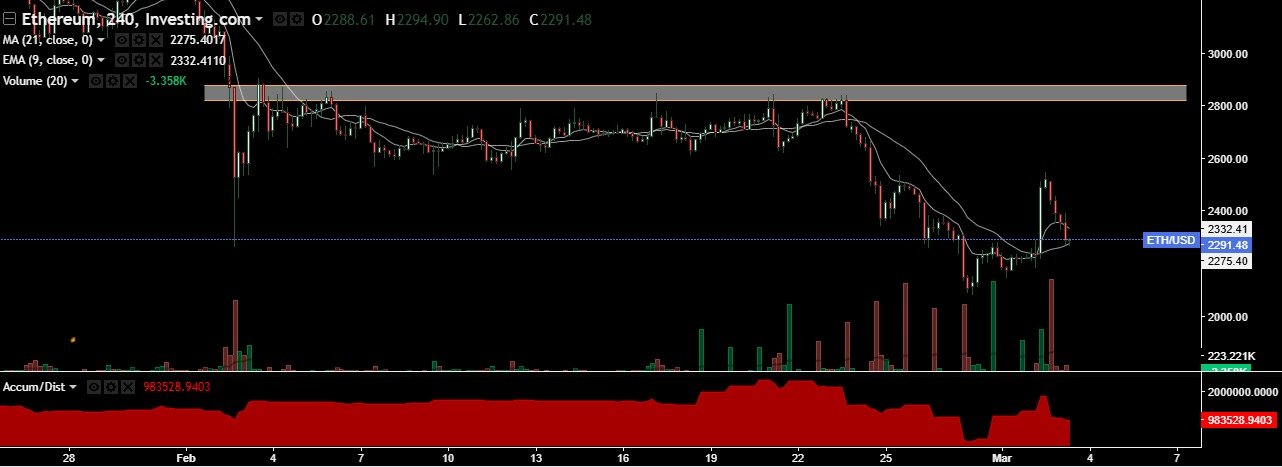
Technical Indicators & Market Sentiment for ETH Trading Signal
Moving Averages (EMA & MA):
• ETH is currently trading near the 9-period EMA and 21-period MA, indicating a neutral to slightly bearish short-term outlook.
• A break above the moving averages could reinforce a bullish recovery, signaling a potential ETH trading signal for long positions.
Volume & Market Strength:
• Trading volume has seen fluctuations, indicating uncertainty among traders.
• If ETH experiences a volume surge near key levels, it could confirm the next major move, offering a reliable ETH trading signal.
Accumulation/Distribution Indicator:
• The Accum/Dist indicator shows mixed sentiment, suggesting a battle between bulls and bears.
• A rise in accumulation could indicate increasing buying interest, signaling a potential bullish ETH trading signal.
Conclusion & ETH Trading Signal Strategy
Ethereum is at a crucial price zone, where price action around $2,170 and $2,547 will determine its next move. Traders looking for ETH trading signals should watch for breakout or breakdown patterns to adjust their positions accordingly.
Bullish Scenario: A breakout above $2,547 could push ETH toward $2,860 and possibly $3,000, providing a clear ETH trading signal for further upward movement.
Bearish Scenario: A break below $2,170 may lead to a decline toward $2,050, with a further drop to $1,910 if selling pressure increases, signaling a bearish ETH trading signal.


Your point of view caught my eye and was very interesting. Thanks. I have a question for you.
I don’t think the title of your article matches the content lol. Just kidding, mainly because I had some doubts after reading the article. https://www.binance.com/bn/register?ref=WTOZ531Y