Read Time:1 Minute, 48 Second
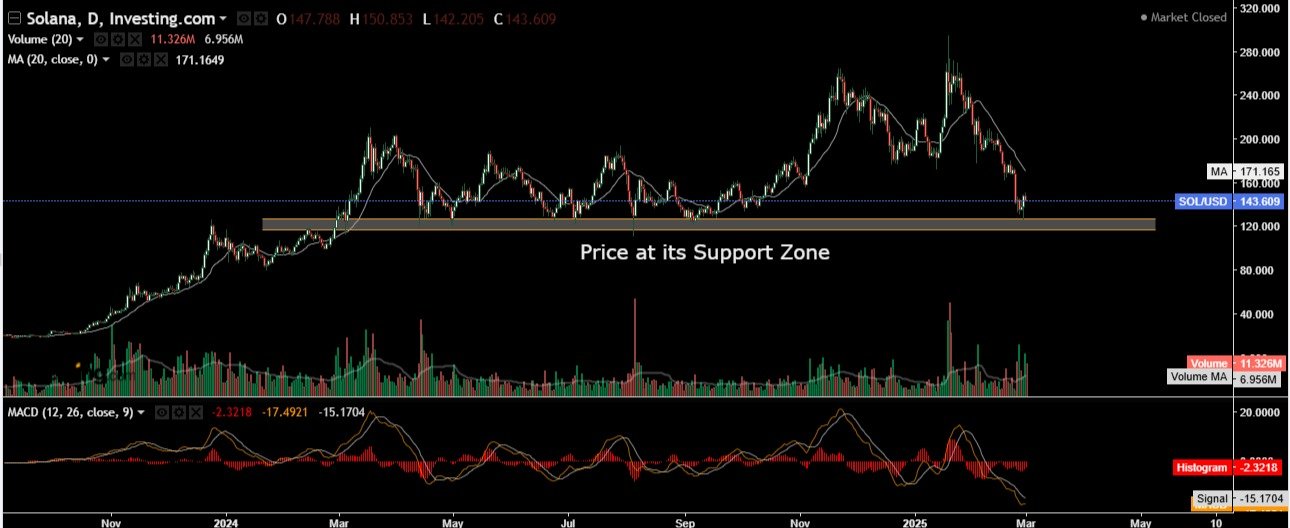
Solana price (SOL/USD) is testing a crucial demand zone as selling pressure intensifies. This analysis evaluates key support levels, technical indicators, and potential price action scenarios to provide a clearer outlook for traders and investors.
Key Technical Levels and Breakdown Risks
- Support Zone: Solana price is currently trading near a major support range between $120-$130. A breakdown below this level could accelerate losses.
- 20-Day Moving Average: The 20-day MA stands at $171.16, reinforcing the bearish momentum.
- Critical Breakdown Level: A decisive close below $110 on the daily, weekly, or monthly timeframe could confirm a deeper decline towards $80-$85.
- Next Major Demand Zone: If Solana price fails to hold $80, the next significant support is around $50.
Indicator Analysis
Volume and Market Sentiment
- Current Volume: 11.32M, significantly above the 6.95M moving average, indicating heightened selling pressure.
- Bearish Confirmation: Increased volume on price declines suggests strong bearish sentiment.
MACD (12, 26, 9) Analysis
- MACD Line: -15.17
- Signal Line: -17.49
- Histogram: -2.32
- Momentum Outlook: The MACD remains in bearish territory, with no signs of an immediate recovery.
Key Support and Resistance Levels
- Immediate Resistance: $160, followed by the $171.16 MA.
- Major Support: $110 (critical level to hold).
- Downside Targets: If $110 breaks, expect a drop to $80-$85. A failure at this level could drive the price down to $50.
Price Action Scenarios
- Bearish Continuation: A daily, weekly, or monthly close below $110 will likely lead to a move toward $80-$85. If this level fails, $50 becomes the next major target.
- Demand Zone Holds: If buyers defend the $120-$130 range, a relief rally toward $140-$160 is possible.
- Trend Reversal Confirmation: A breakout above $178 could signal a shift in momentum, attracting fresh buying interest.
Conclusion
Solana price faces a critical test at its demand zone. A weekly or monthly close below $110 would confirm a bearish continuation, with $80-$85 as the next support. If this level fails, $50 could be the final defense. Conversely, holding above $110 may trigger a short-term rebound. Traders should closely monitor closing prices for confirmation of the next major move.
Happy
0 %
Sad
0 %
Excited
0 %
Sleepy
0 %
Angry
0 %
Surprise
0 %