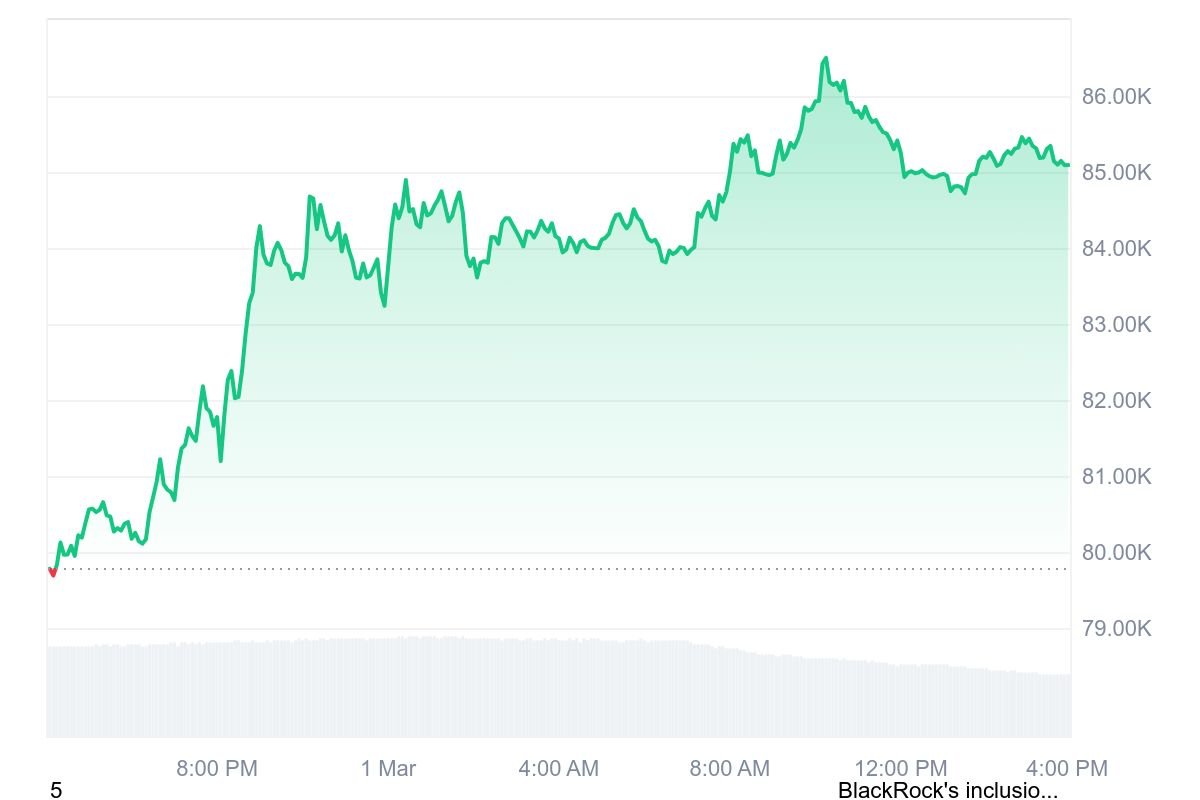
Bitcoin price has experienced a significant breakdown below the crucial support level of $90,000, leading to a bearish continuation. This article will analyze the technical factors contributing to this price action, the critical demand zones, and potential future movements based on historical price behavior and technical indicators.
Key Breakdown Levels and Structure
Bitcoin price has breached several significant levels, including daily, weekly, and monthly lows, signaling a shift in market sentiment. The primary areas of concern are:
Daily Support at $90,000
Previously a strong support level, this was decisively broken, leading to an accelerated downtrend.
Weekly Low Breach
The break of the weekly low further confirmed a bearish structure, increasing selling pressure.
Monthly Low Violation
Losing monthly support levels adds to the broader bearish bias, reinforcing downside risk.
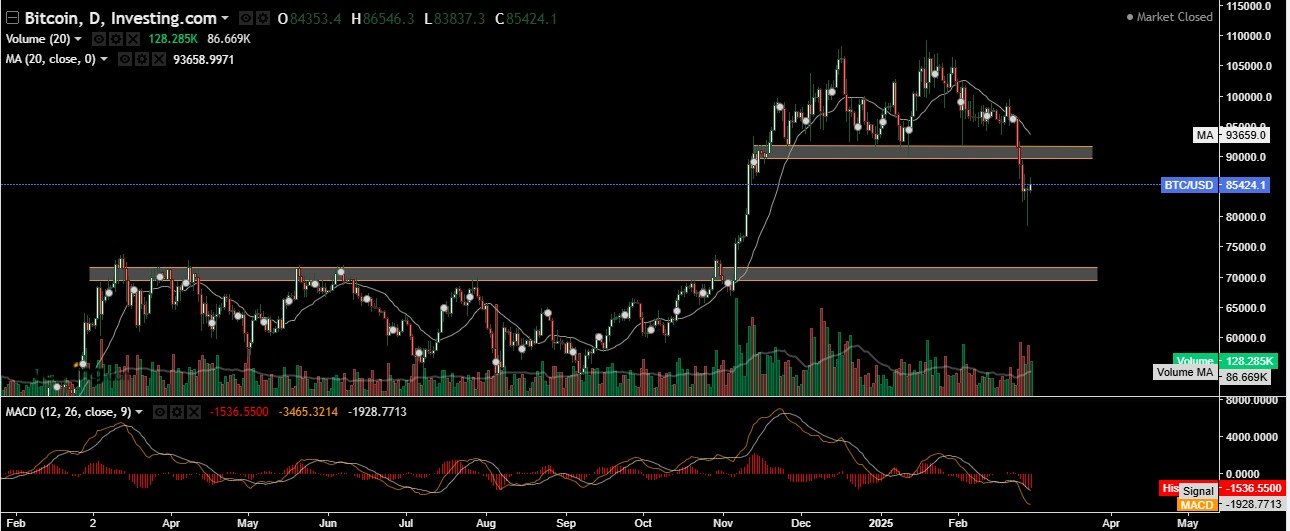
Break of the M-Pattern on the Weekly Chart
The breakdown of the M-shaped pattern on the weekly timeframe indicates further bearish continuation, with sellers firmly in control.
EMA and Volume Analysis
The 20-day Exponential Moving Average (EMA) is trending downward, reflecting strong bearish momentum. Additionally, volume analysis shows a significant increase in selling pressure, suggesting that bears are dominating the market.
Next Demand Zone: $70,000 – $72,000
With the breakdown of previous supports, Bitcoin price’s next major demand zone lies in the $70,000 – $72,000 range. This level has historically acted as a strong accumulation zone and could provide temporary relief if buyers step in.
Market Sentiment and Future Outlook
Bearish Momentum
Until Bitcoin price reclaims $90,000, the trend remains bearish.
Importance of Closing Below Key Levels
A daily and weekly close below the broken support levels will further validate the bearish trend, increasing downside risks.
Potential Rebound
If Bitcoin price finds support in the $70,000 – $73,000 range, a short-term bounce is possible.
Further Downside Risk
A failure to hold above $70,000 could lead to deeper corrections.
Conclusion
The loss of $90,000 has triggered a strong bearish move, breaking all critical support levels across multiple time frames. The confirmed break of the M-pattern on the weekly chart further strengthens the bearish outlook. Traders should closely monitor Bitcoin price action near the $70,000 – $73,000 demand zone, as this level will determine Bitcoin’s next directional move.
Note: Until a clear reversal is confirmed, caution is advised, and further downside cannot be ruled out.