The White House recently hosted a high-profile Crypto Summit, bringing together policymakers, industry leaders, and financial regulators to discuss the future of digital assets.
However, many in the crypto community have expressed disappointment, arguing that the event lacked meaningful outcomes and failed to address key industry concerns.
Expectations vs. Reality
Leading up to the Crypto Summit, many expected concrete regulatory frameworks, clearer policies, and progressive discussions on fostering innovation in the cryptocurrency space. Instead, attendees reported vague discussions, political rhetoric, and little commitment to actual change.
Regulatory Concerns: The discussions largely centered around risks, fraud prevention, and consumer protection, rather than fostering innovation or adoption.
Lack of Concrete Action: Despite hours of talks, no significant regulatory framework or executive action was announced.
Political Grandstanding: Some attendees felt the summit was more of a PR move rather than an effort to create a balanced approach to crypto regulation.
Many argue that this summit was a missed opportunity to bridge the gap between regulators and the crypto industry. With growing mainstream adoption of digital assets, the need for clear, forward-thinking policies has never been greater.
as is tradition, intern notes on the White House Crypto Summit covering
– Strategic Bitcoin Reserve
– Stablecoin Growth
– Beating China
While the Crypto Summit aimed to address pressing issues in the industry, many believe it fell short of expectations. Without decisive action, skepticism around the government’s stance on crypto will continue to grow.
The question remains—will future summits bring real change, or will they continue to be perceived as mere formalities?
What do you think? Was the Crypto Summit a waste of time, or did it serve a purpose? Share your thoughts below!
Institutional investors are the backbone of financial markets, driving liquidity, stability, and long-term investment strategies. These powerful entities—hedge funds, banks, pension funds, insurance companies, and mutual funds command vast capital reserves, enabling them to influence stock prices, bond yields, and even entire economies. But how do they operate, and how do they impact global markets?
This article explores the world of institutional investors, their strategies, market influence, and the role they play in shaping financial trends.
Who Are Institutional Investors?
They are large entities that invest substantial amounts of money on behalf of clients, members, or policyholders. Unlike retail investors, who trade in smaller quantities, institutions execute high-volume trades, often dictating market movements.
Types of Institutional Investors
Hedge Funds – Known for aggressive strategies, hedge funds aim to maximize returns through leverage, derivatives, and short selling.
Banks & Investment Firms – Banks invest in various asset classes to generate returns and manage risk.
Pension Funds – These funds manage retirement savings, investing in stocks, bonds, and alternative assets.
Insurance Companies – Invest in stable, long-term assets to meet future payout obligations.
Mutual Funds & ETFs – Pool capital from retail investors to invest in diversified portfolios.
Each type plays a unique role in market dynamics, influencing everything from stock valuations to interest rates.
How Institutional Investors Shape Financial Markets
1. Market Liquidity & Price Stability
Institutional investors contribute to market liquidity, ensuring that assets can be bought and sold efficiently. Their high trading volumes help stabilize stock prices, reducing volatility caused by individual investors’ emotional buying and selling.
Example: When a pension fund buys millions of shares in a blue-chip company, it boosts market confidence, preventing erratic price swings.
2. Impact on Stock Prices & Indices
Large institutional trades can significantly affect stock prices. Since many institutions follow similar research-backed strategies, their collective movements create bullish or bearish trends.
Example: If major mutual funds increase holdings in tech stocks, retail investors often follow, further fueling price growth.
3. Influence on Corporate Governance
Since institutional investors own large portions of publicly traded companies, they have a say in corporate governance. They push for higher accountability, better management decisions, and improved shareholder value.
Example: Activist hedge funds pressure companies to restructure, optimize performance, or replace underperforming CEOs.
4. Role in Bond & Debt Markets
These players dominate the bond markets, influencing interest rates and government borrowing costs. Their demand for bonds determines how cheaply or expensively governments and corporations can raise capital.
Example: If pension funds heavily invest in U.S. Treasury bonds, yields drop, making borrowing cheaper for businesses.
Investment Strategies Used by Institutional Investors
1. Value Investing
Many institutions follow Warren Buffett-style value investing—buying undervalued stocks with strong fundamentals.
2. Growth Investing
Focusing on companies with high future potential, institutional investors pour billions into tech giants like Apple, Amazon, and Tesla.
3. Quantitative Trading
Hedge funds deploy AI-driven algorithms to execute trades based on statistical models, capitalizing on short-term price inefficiencies.
Institutional investors increasingly favor sustainable investments, rewarding companies with ethical business practices.
Challenges & Risks Associated with Institutional Investors
1. Market Manipulation Concerns
Due to their massive capital, institutions can influence prices, sometimes leading to concerns over market fairness.
2. Systemic Risks & Financial Crises
During economic downturns, institutional investors pulling out funds can accelerate market crashes. The 2008 financial crisis was partly driven by hedge funds and banks liquidating positions.
3. Regulatory Scrutiny
Governments impose strict regulations to prevent unethical trading practices and financial instability caused by institutions.
The Future of Institutional Investing
These Investors will continue shaping financial markets, with emerging trends like AI-driven investments, cryptocurrency adoption, and sustainable investing gaining traction. Their role in stabilizing economies, driving innovation, and influencing global finance is undeniable.
For retail investors, understanding institutional strategies can provide valuable insights into market movements and potential investment opportunities. Whether you’re an aspiring trader or a passive investor, keeping an eye on institutional trends can help you make informed decisions.
Key Takeaways:
Institutional investors influence stock prices, bond yields, and market stability.
Their strategies include value investing, growth investing, and algorithmic trading.
They contribute to liquidity but also pose risks like market manipulation and systemic crises.
ESG investing is a growing focus among institutions.
Understanding institutional trends can benefit retail investors.
By staying informed about institutional investing, market participants can better navigate financial markets and optimize their investment strategies.
In 2021, NFTs (Non-Fungible Tokens) became synonymous with digital ownership, fueled by record-breaking sales and viral hype. However, by 2023, the market faced a stark downturn, with trading volumes collapsing and critics declaring NFTs “dead.”
Drawing insights from DappRadar’s analysis of the ongoing “NFT winter,” this article explores whether NFTs are truly obsolete or simply transitioning into a more mature phase.
The Meteoric Rise and Sudden Chill
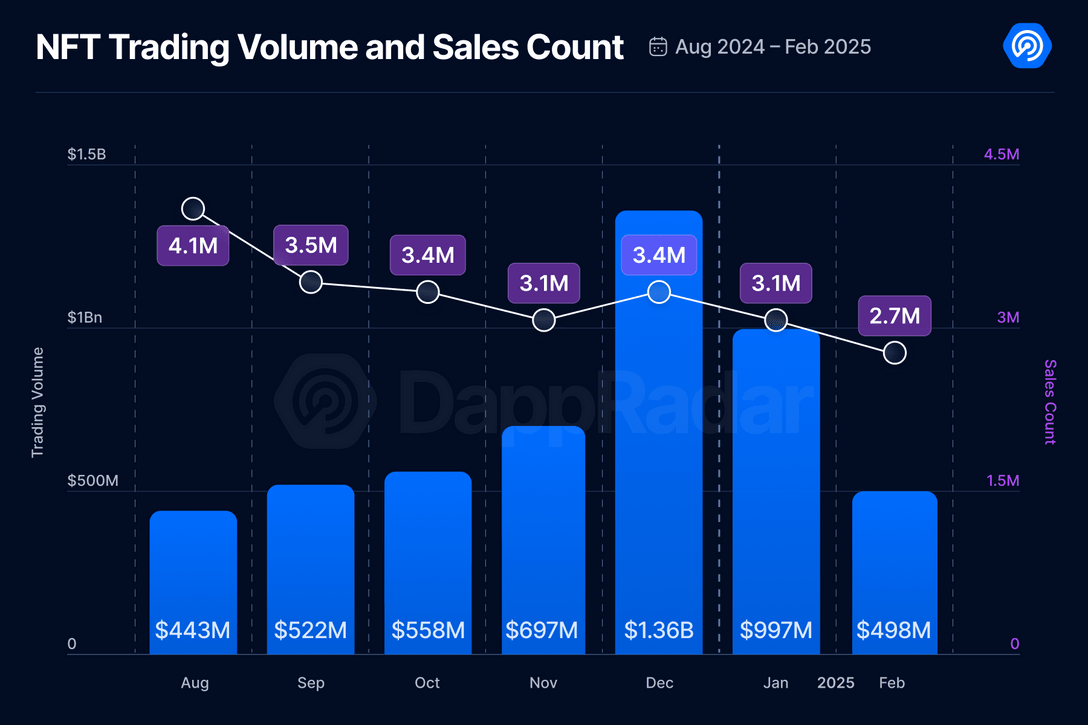
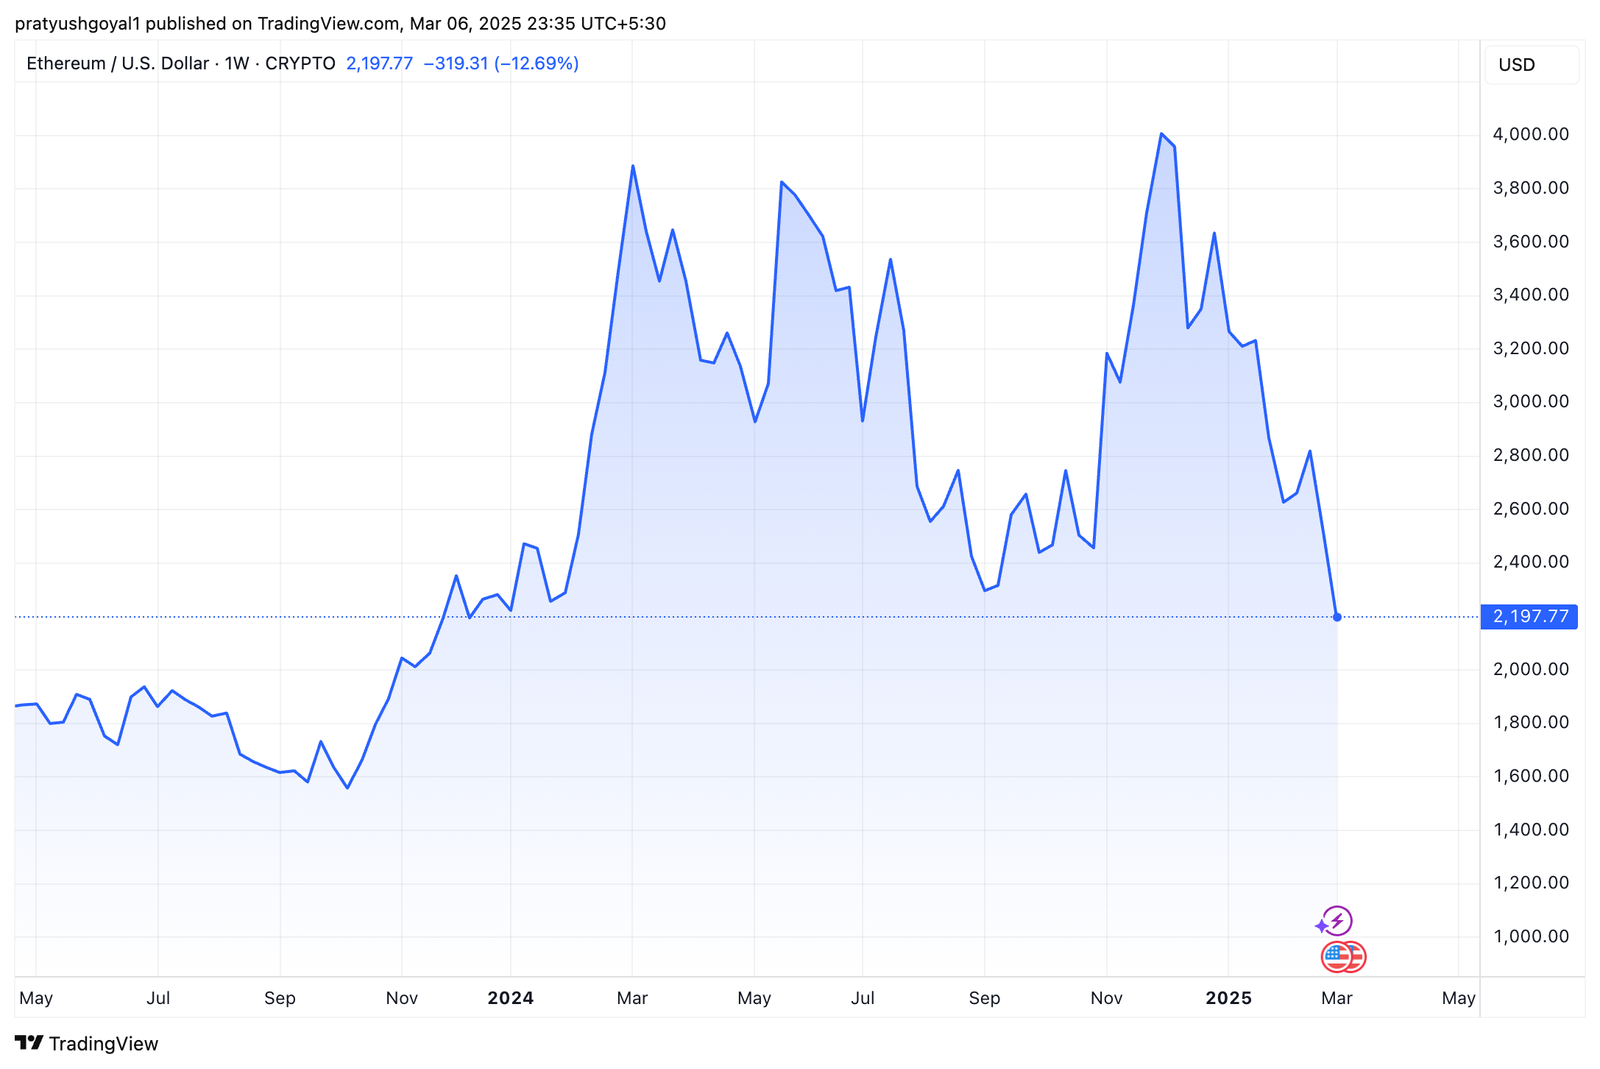
The NFT market’s 2021 boom, which saw $25 billion in trading activity, was driven by speculative fervor and cultural momentum. Yet, DappRadar’s 2023 report highlights a brutal correction: the NFT market shrank by over 50% in Q2 2023, with trading volumes plummeting to $1.7 billion—down from $3.9 billion in Q1.
This decline mirrors broader crypto market struggles, as falling Bitcoin and Ethereum prices eroded investor confidence.
Key factors behind the downturn include:
– Crypto Price Collapse: Ethereum (the backbone of most NFTs) dropped over 60% from its 2021 peak, directly impacting NFT valuations.
– Liquidity Crunch: Buyers vanished, leaving sellers struggling to offload assets. For instance, Bored Ape Yacht Club’s floor price fell from 150 ETH in 2022 to under 30 ETH by mid-2023.
– Speculative Fatigue: Many projects failed to deliver utility, leading to disillusionment.
The Current State: Survival of the Fittest
While the market is battered, NFTs are not extinct. DappRadar notes niche resilience in sectors like gaming, art, and membership-based utilities:
1. Gaming NFTs: Games like Axie Infinity and Parallel retained dedicated user bases, with in-game asset trading sustaining activity.
2. Blue-Chip Art: Established collections like CryptoPunks and Art Blocks saw relative stability, signaling enduring cultural value.
3. Brand Experiments: Companies like Starbucks (with its Odyssey loyalty program) and Reddit (with avatar NFTs) quietly expanded Web3 integrations, focusing on utility over speculation.
Challenges Amplified by the “NFT Winter”
DappRadar’s analysis underscores systemic issues:
– Platform Struggles: Marketplaces like OpenSea faced layoffs and declining fees, while competitors like Blur prioritized trader incentives, fragmenting liquidity.
– Regulatory Heat: Governments intensified scrutiny of NFT scams and IP violations, creating uncertainty for creators.
– Creator Royalty Erosion: Platforms like Blur and Magic Eden abandoned enforced royalties, squeezing artist revenue.
Innovation Amid the Freeze
Despite the gloom, builders are pushing for long-term value:
1. Layer-2 Blockchains: Ethereum scaling solutions (e.g., Polygon, Arbitrum) reduced gas fees by 80–90%, making NFTs accessible to mainstream users.
2. Dynamic NFTs: Projects like Async Art enable updatable NFTs, useful for gaming or real-world data tracking.
3. DeFi Integration: NFT fractionalization platforms (e.g., Unicly) allow shared ownership, improving liquidity.
The Path Forward
DappRadar suggests the market’s future hinges on:
– Utility-Driven Models: NFTs tied to experiences (e.g., concerts, subscriptions) or physical goods (e.g., luxury authentication).
– Institutional Adoption: Brands like Nike and Tiffany leveraging NFTs for community engagement, not quick profits.
– Regulatory Clarity: Clearer rules could stabilize the market and attract traditional investors.
Conclusion: Winter is a Season, Not an End
The NFT market is undeniably colder, but reports of its death are exaggerated. As DappRadar notes, the downturn has purged speculators, allowing serious projects to focus on sustainable use cases. Just as the dot-com crash paved the way for tech giants, the “NFT winter” may ultimately strengthen the ecosystem.
The era of easy money is over, but the technology’s potential—for digital ownership, creative economies, and decentralized identity—remains alive. NFTs aren’t dead; they’re growing up.
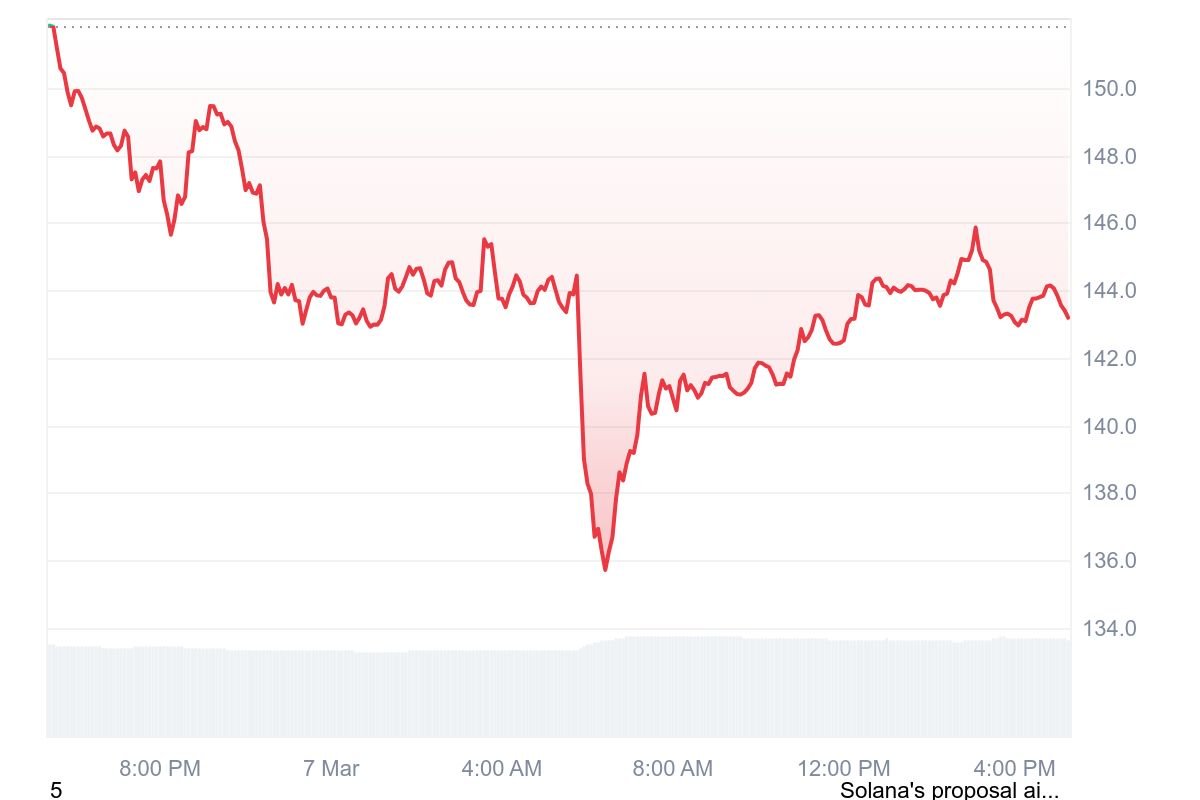
GrokCoin is a meme-based cryptocurrency launched on the Solana blockchain, inspired by xAI’s Grok AI, which was developed by Elon Musk. The token quickly gained attention after Grok AI itself suggested the name, sparking a massive trading frenzy.
The Rise of GrokCoin
GrokCoin started with a market capitalization of just $56,000, but within hours, it surged past $25 million. Trading volumes skyrocketed beyond $100 million, reflecting immense community interest. This rapid surge was fueled by social media buzz, speculative trading, and perceived endorsements from Elon Musk, who has a history of influencing meme coin trends.
Why is GrokCoin Gaining Popularity?
Elon Musk Connection – The association with Musk’s xAI Grok AI has driven significant hype.
Community-Driven Momentum – A highly active online community has contributed to its rapid growth.
Exchange Listings – GrokCoin has been listed on BitMart and LBank, offering trading incentives and increasing accessibility.
AI and Crypto Fusion – It represents the growing trend of AI-themed cryptocurrencies, combining artificial intelligence with blockchain-based digital assets.
Concerns and Risks of GrokCoin
Despite its meteoric rise, GrokCoin also faces several challenges:
Sustainability Issues – As a meme coin, its long-term viability is uncertain.
Liquidity Risks – Sudden price movements can lead to liquidity problems.
Regulatory Uncertainty – As with all cryptocurrencies, legal scrutiny remains a factor.
The Future of GrokCoin
While some believe GrokCoin could lead a new wave of AI-themed meme coins, others warn that its success hinges on continued community engagement and market interest. Whether it will maintain its momentum or fade like many meme coins remains to be seen. However, it has undeniably captured the attention of the crypto and AI communities alike.
Conclusion
GrokCoin is an emerging AI-inspired meme coin that has gained massive traction within the cryptocurrency market. With backing from an enthusiastic community and its connection to Elon Musk’s Grok AI, it continues to make waves. However, potential investors should remain cautious, as meme coins are known for their volatility.
For those asking, “What is GrokCoin?”—it is a fast-growing memecoin on Solana, capitalizing on the intersection of AI, crypto, and social media-driven hype.
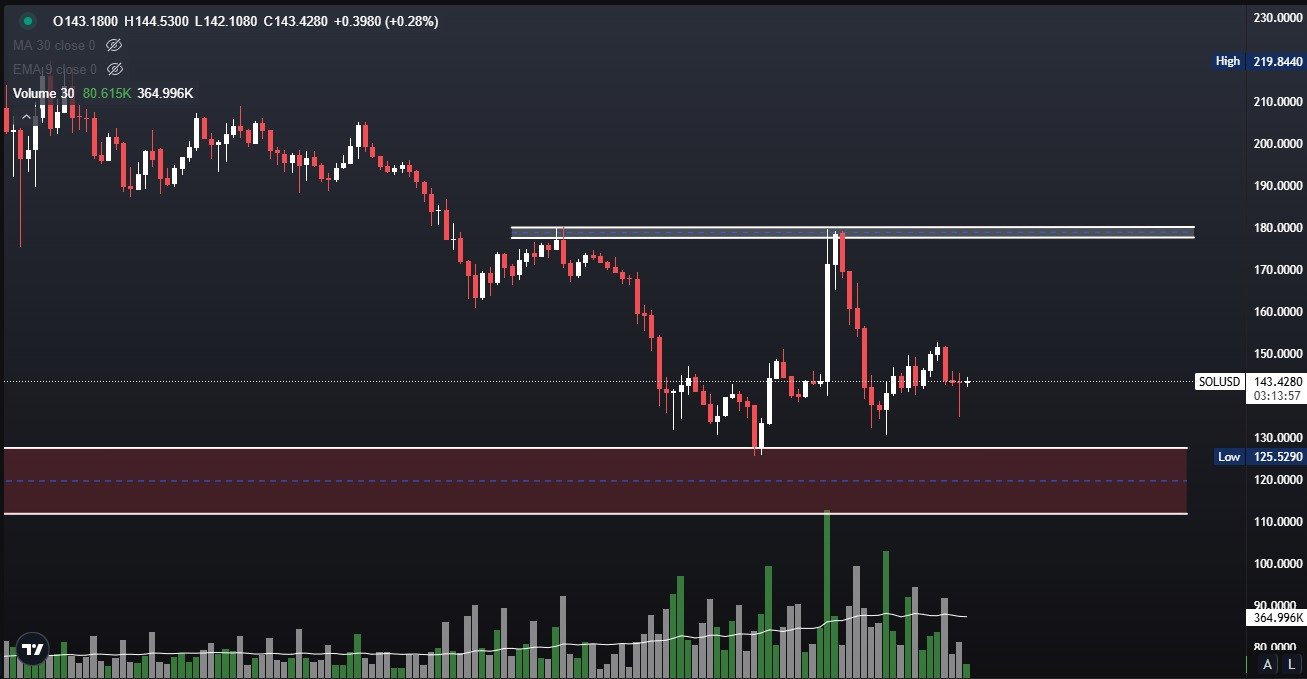
SOL continues to trade within a consolidation range, with buyers and sellers battling at critical support and resistance levels. The chart indicates that price action is approaching key decision points that will likely determine the next significant move.
Currently, SOL is struggling to break above the $150 – $155 resistance range, indicating strong selling pressure at these levels. If the price manages to break and sustain above $155, it could trigger a wave of bullish momentum, leading to an initial target of $178 – $180. A further breakout above $180 would likely induce short covering, potentially pushing SOL toward $188 – $190.
On the downside, the $130 – $135 demand zone is crucial for preventing further declines. A failure to hold this support could expose SOL to deeper losses, with the next major support resting at $120. If SOL breaches this level, bearish sentiment may strengthen, leading to an extended downtrend.
Volume & Momentum:
The volume indicator shows increased activity near support and resistance zones, suggesting active participation from both bulls and bears. The recent rejection near $155 aligns with strong historical resistance, while the demand zone around $130 is a key area to monitor for buyer re-entry.
Solana Technical Analysis: Conclusion
SOL remains at a pivotal point, with $155 acting as the key resistance and $130 as the critical support. Traders should closely observe price action at these levels. A breakout above $155 could lead to further upside movement towards $180, while a breakdown below $130 might accelerate losses towards $120.
However, the price is still under bearish control, and long positions remain highly risky at this stage. It is advisable to wait for clear confirmation of a trend reversal before considering any long trades.
Stay cautious and adjust risk management strategies accordingly.
Bitcoin, the first and most prominent cryptocurrency, has garnered widespread attention since its creation in 2009. With growing institutional interest, many wonder: Which organization holds the most Bitcoin in 2025?
As of now, several organizations and companies have made significant investments in Bitcoin, holding vast amounts of the digital asset. Here, we explore the top organizations and their Bitcoin holdings, with a focus on the year 2025.
1. Satoshi Nakamoto: The Largest Bitcoin Holder
Before diving into contemporary institutional holders, it’s important to note the largest known holder of Bitcoin—the mysterious creator of the cryptocurrency, Satoshi Nakamoto. Although the true identity of Nakamoto remains a mystery, it is believed they mined around 1 million bitcoins in the early days of Bitcoin’s existence. As of 2025, these coins remain untouched, making Satoshi the largest holder.
Though these coins haven’t moved, Nakamoto’s stash remains a significant part of Bitcoin’s supply and has sparked much curiosity. However, as these coins remain dormant, Nakamoto’s holdings don’t affect the market, leaving room for other organizations to emerge as active Bitcoin holders.
2. MicroStrategy: Leading the Corporate Bitcoin Rush in 2025
As of 2025, the American business intelligence firm MicroStrategy holds the most Bitcoin among publicly traded companies. MicroStrategy’s Bitcoin holdings surpass 120,000 BTC, making it the largest corporate Bitcoin holder. This strategic decision began in 2020 under the leadership of CEO Michael Saylor, who saw Bitcoin as a hedge against inflation and a store of value.
MicroStrategy’s consistent purchasing of Bitcoin has made it a major player in the Bitcoin market. The company’s holdings are stored securely in cold storage, and its Bitcoin strategy has influenced many other companies to consider Bitcoin as part of their treasury management.
3. Tesla’s Bitcoin Holdings in 2025
Electric vehicle manufacturer Tesla has also been a significant player in the Bitcoin market. In early 2021, Tesla purchased $1.5 billion worth of Bitcoin, making headlines in the corporate world. By 2025, Tesla still holds a notable amount of Bitcoin, with estimates suggesting the company owns around 42,000 bitcoins.
While Tesla has sold off a portion of its Bitcoin holdings over the years, it continues to hold Bitcoin as part of its treasury reserve strategy. Tesla’s involvement in Bitcoin has further helped mainstream cryptocurrency adoption, especially in the corporate sector.
4. Grayscale Bitcoin Trust (GBTC): A Major Institutional Player
Another top contender in the race for the most Bitcoin is Grayscale Bitcoin Trust (GBTC). As of 2025, GBTC holds more than 600,000 bitcoins on behalf of institutional investors. GBTC provides a regulated and accessible way for institutional investors to gain exposure to Bitcoin without directly owning or managing the cryptocurrency.
This makes Grayscale a critical player in the Bitcoin market, and its large holdings reflect the growing institutional demand for Bitcoin. The trust’s shares trade on public markets, offering liquidity while ensuring safe, regulated access to Bitcoin.
5. Block.one: EOS Blockchain’s Bitcoin Holdings in 2025
Block.one, the company behind the EOS blockchain, is another significant Bitcoin holder. As of 2025, Block.one owns around 140,000 bitcoins. The company accumulated these coins during its initial coin offering (ICO) and has held them as part of its treasury. While its main focus remains on the EOS blockchain, its Bitcoin holdings play a crucial role in its overall financial strategy.
Block.one’s decision to hold Bitcoin is a testament to the strategic role that cryptocurrency plays for blockchain-related companies. Its significant holdings contribute to its standing as one of the largest Bitcoin holders in 2025.
6. Other Organizations Holding Bitcoin in 2025
Several other organizations hold significant amounts of Bitcoin in 2025, contributing to the growing institutional adoption of the digital asset. These include:
Coinbase: As one of the largest cryptocurrency exchanges globally, Coinbase holds substantial amounts of Bitcoin, primarily in its user wallets. While these holdings are not exclusively owned by Coinbase itself, the exchange’s volume and market presence make it a major entity in Bitcoin’s ecosystem.
Bitfinex: Another major cryptocurrency exchange, Bitfinex, is known for holding a large number of Bitcoin in cold storage. As one of the most active exchanges in the Bitcoin market, Bitfinex plays a crucial role in facilitating large Bitcoin trades.
SpaceX: In addition to Tesla, SpaceX—Elon Musk’s aerospace company—has also reportedly purchased Bitcoin. As of 2025, SpaceX holds an estimated amount of Bitcoin, further solidifying Musk’s influence in the cryptocurrency space.
Conclusion: Who Holds the Most Bitcoin in 2025?
As of 2025, Satoshi Nakamoto remains the largest known holder of Bitcoin, with over 1 million BTC, though these coins are inactive. However, among active holders, MicroStrategy is the leader with more than 120,000 bitcoins. Tesla, Grayscale Bitcoin Trust, and Block.one are also major institutional holders, showcasing the growing adoption of Bitcoin by corporations and investment vehicles.
With increasing institutional adoption and growing corporate treasuries holding Bitcoin, it is clear that the landscape of Bitcoin ownership continues to evolve in 2025. As the digital asset gains more mainstream acceptance, the question of which organization holds the most Bitcoin will likely continue to evolve.
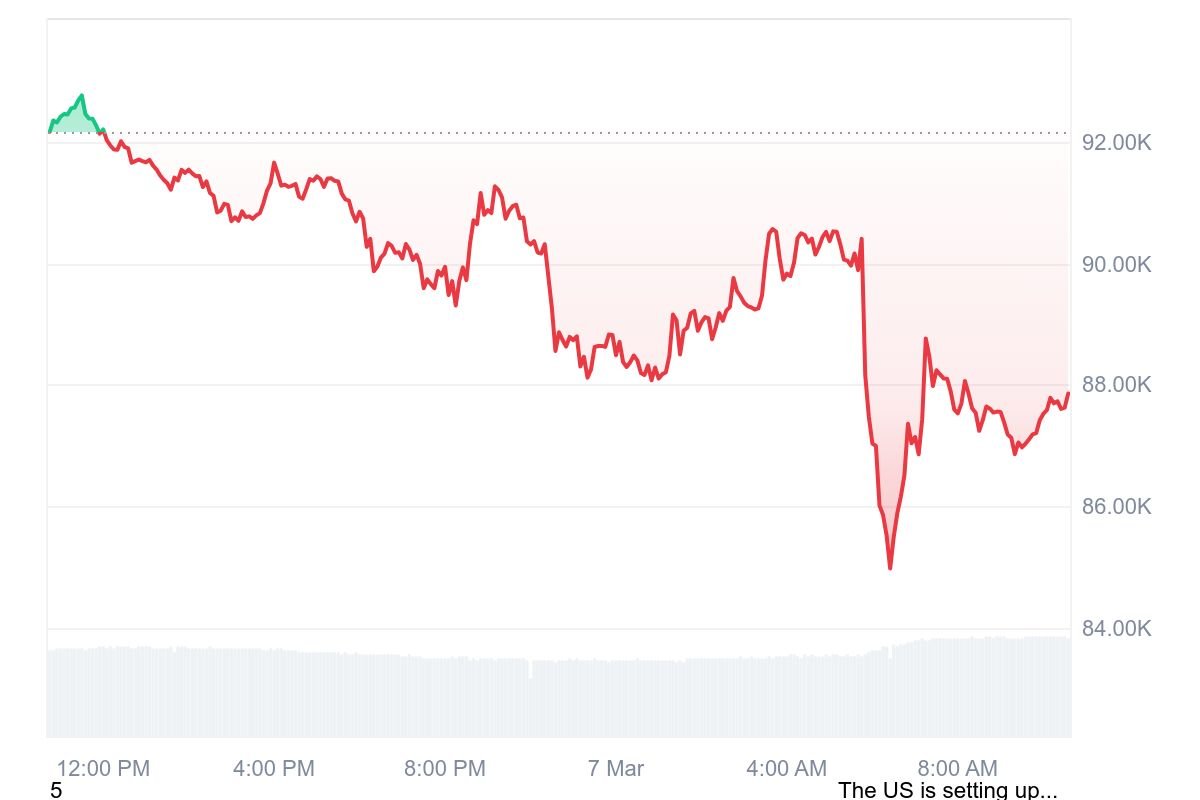
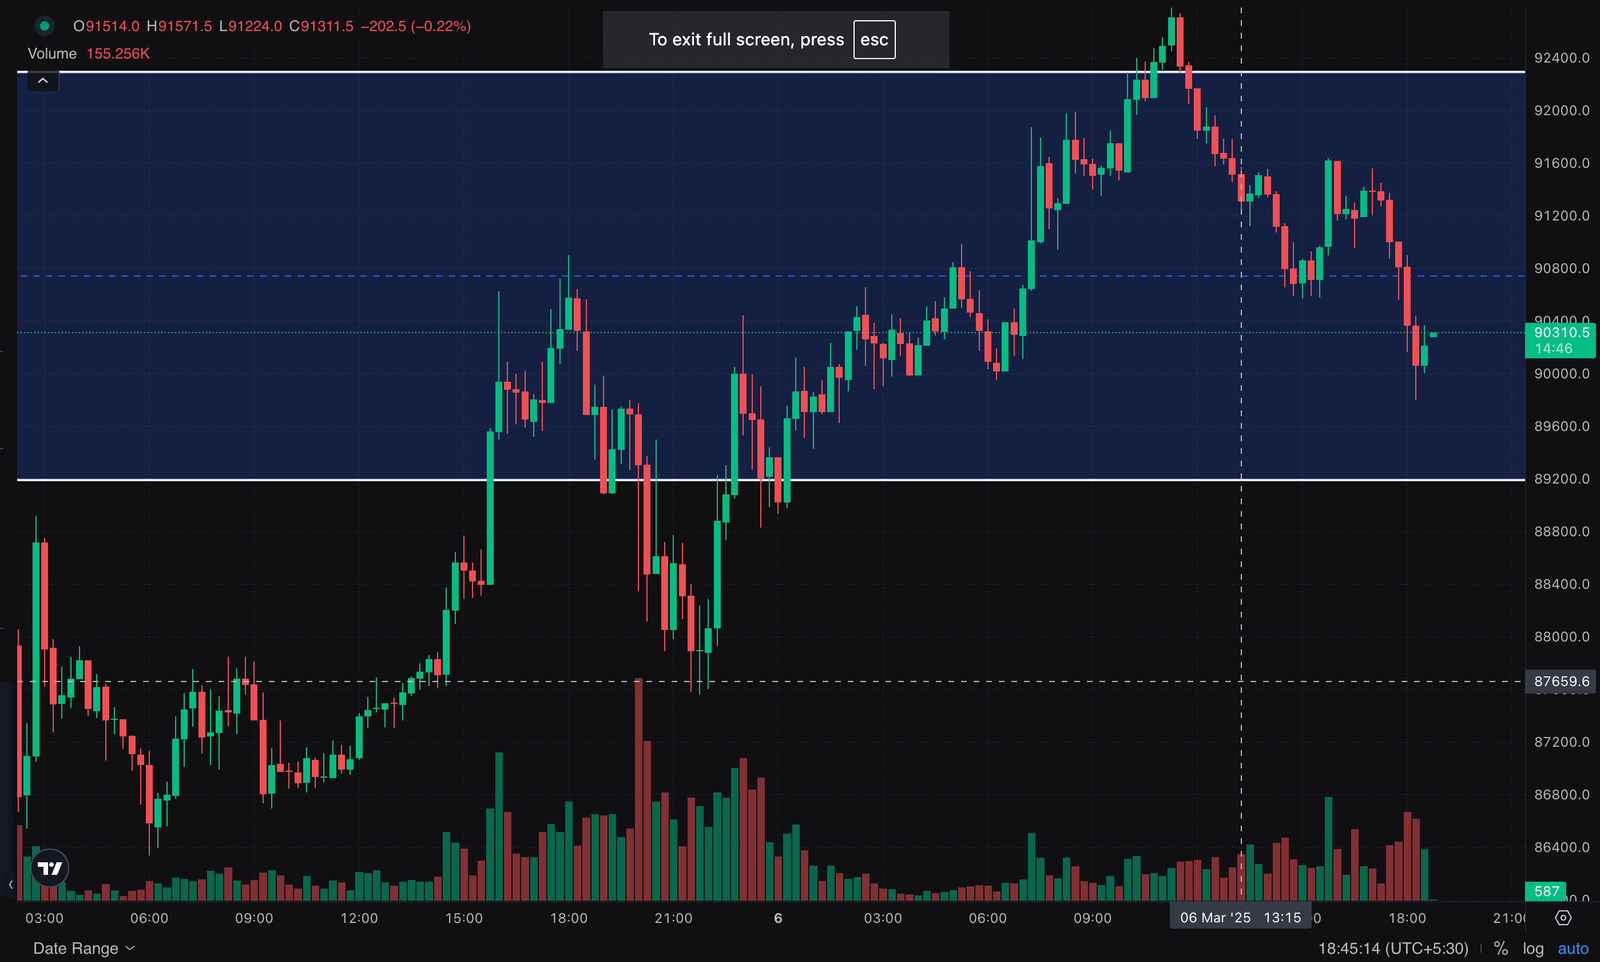
Bitcoin trading signal indicates that BTC remains under bearish pressure, with price action testing critical supply and demand zones that could determine the next major move. Traders should closely watch these levels for potential breakout or breakdown scenarios to make informed trading decisions.
Key Bitcoin Trading Levels:
Supply Zone: $94,000 – $95,000
Demand Zone: $80,000 – $81,000
Upside Breakout Target: $100,000
Downside Breakdown Target: $72,000 – $73,000
Market Analysis:
Bitcoin is struggling near $87,563, failing to gain strong bullish momentum. The recent rejection at $94,967 highlights significant selling pressure.
A breakout above $95K, supported by strong volume, could fuel a short squeeze, pushing BTC toward the $100K psychological level.
A break below $80K and failure to hold $81,424 could trigger further downside, potentially leading BTC into the $72K – $73K demand zone.
Volume & Momentum Insights:
Volume analysis shows heightened activity from both institutional and retail traders, but the lack of sustained buying pressure suggests that sellers remain dominant.
Conclusion – Bitcoin Trading Signal Strategy:
BTC sits at a critical decision point, with $95K acting as a key resistance and $80K as a crucial support level.
A breakout above $95K may trigger a rally to $100K, while a breakdown below $80K could lead to further downside pressure.
Trading Strategy Recommendation:
Traders should closely monitor these critical levels, watch for volume confirmation, and adjust risk management strategies accordingly to capitalize on Bitcoin’s next major move.
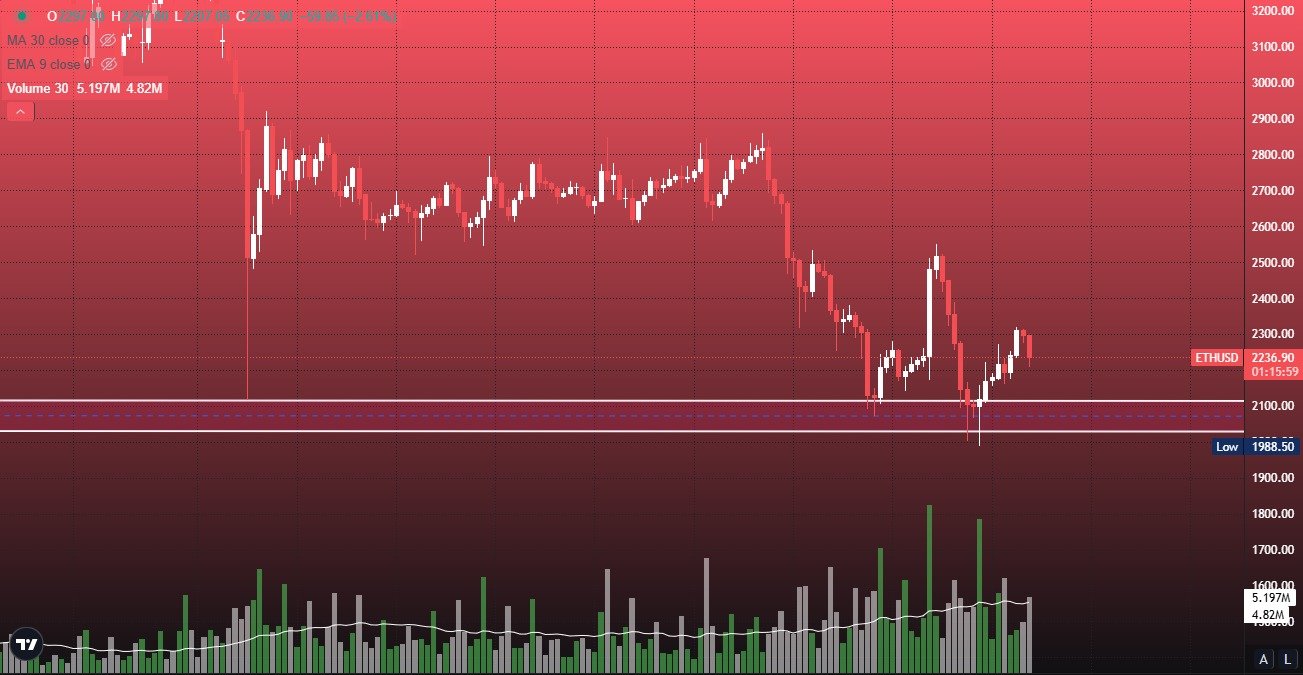
Ethereum (ETH/USD) has recently bounced from the key support level around $1,995, showing a potential recovery. However, price action remains uncertain, and traders should closely monitor critical support and resistance levels to anticipate the next move.
Date: 6 Mar 2025 Timeframe: (Assumed 4H or Daily Chart Based on Image) Current Price:$2,245 Support Levels:$1,995 – $1,990 Resistance Levels:$2,315 – $2,520
• The price has shown a strong bounce from $1,995, indicating potential short-term buying pressure.
• However, ETH remains in a downtrend, as seen from lower highs and lower lows.
• Bearish momentum is still dominant, indicating sellers are in control.
• A break below $1,990 could trigger another sell-off, potentially driving ETH to $1,700 as the next significant support level.
Green volume spikes indicate buying interest at lower levels.
However, overall volume remains moderate, suggesting caution.
• Moving Averages:
The chart features 30-period MA and 9-period EMA, which are trending downward, confirming the bearish bias.
• Momentum Outlook:
If ETH sustains above $2,245, bullish momentum may push it towards $2,315.
A failure to hold above this level increases the probability of another leg down.
ETH Trading Signal: Trade Scenarios & Strategy
Bullish Scenario (Breakout Above $2,315)
• If ETH breaks and closes above $2,315, it may trigger further upside momentum.
• Target:$2,520 (Major resistance level)
• Stop-Loss: Below $2,245 to minimize risk
Bearish Scenario (Break Below $1,990)
• A breakdown below $1,990 could confirm another bearish leg.
• Target:$1,700 (Key support level)
• Stop-Loss: Above $2,050
ETH Trading Signal: Conclusion
Ethereum is at a *critical inflection point, with a *range-bound structure between *$1,990 and $2,315. Traders should watch for a *breakout in either direction before taking decisive positions.
• Bullish Bias: If price sustains above $2,315, potential rally towards $2,520.
• Bearish Bias: If price breaks below $1,990, a decline towards $1,700 is likely.
Recommendation: Wait for a breakout confirmation before entering trades. Use proper risk management strategies to avoid unexpected volatility.
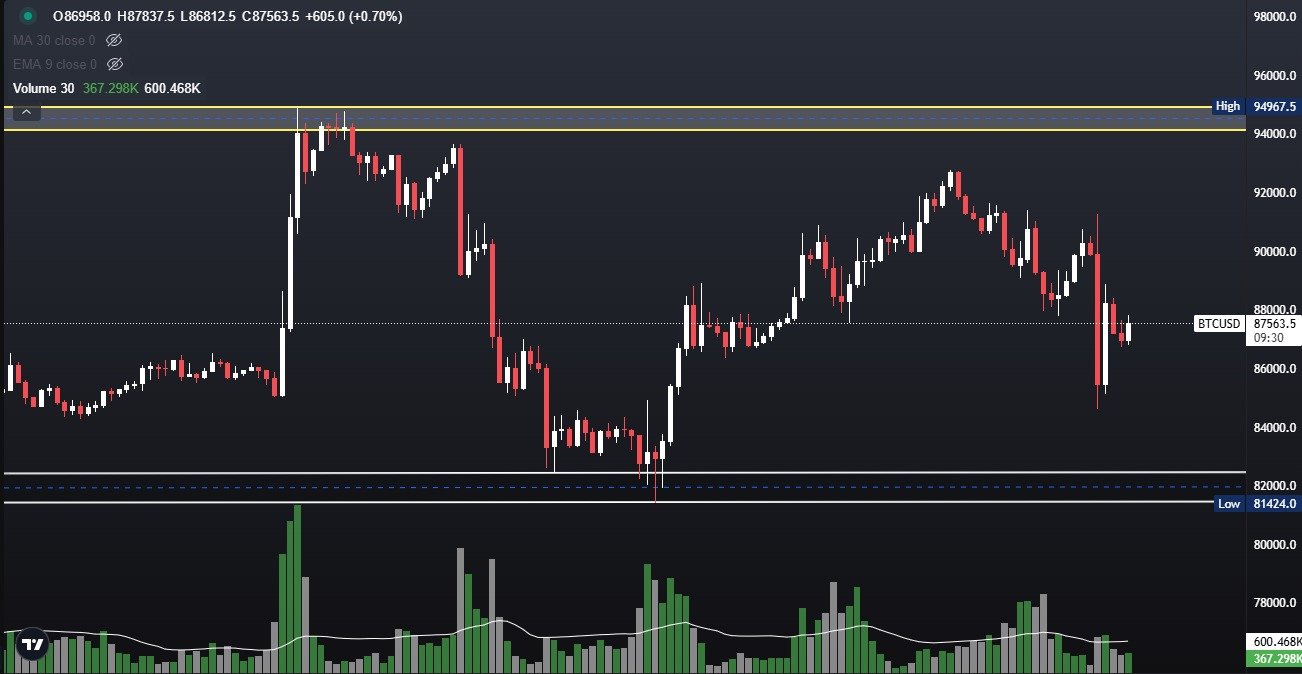
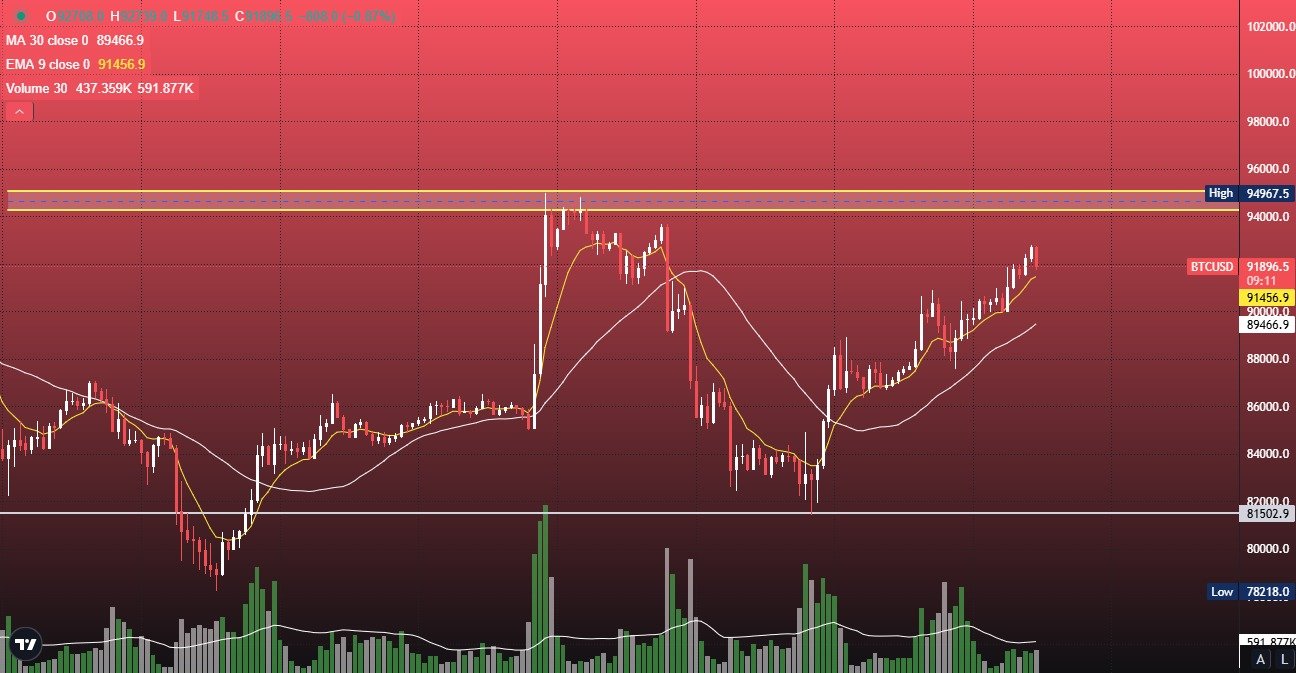
Bitcoin (BTC/USD) is showing signs of structural change, transitioning from lower lows to higher highs, indicating that momentum is shifting. The price has successfully held key support levels and is now testing a critical resistance zone at $94,000-$95,000.
A breakout above this level could fuel a rally toward $100,000, while a failure could trigger a pullback. Let’s analyze the key levels that will determine Bitcoin’s next move.
Bitcoin Trading Signal: Key Resistance and Support Zones
Bitcoin is currently testing the *$94,000-$95,000 resistance range, which has previously acted as a supply zone. If BTC successfully *breaks and sustains above this level, it could confirm further bullish momentum.
• A breakout above $95,000 with strong volume could push BTC toward the psychological level of $100,000.
• Traders should look for increasing volume and strong candle closes above this resistance for confirmation of a breakout.
Major Resistance: $100,000 (Psychological Barrier)
If BTC clears *$95,000, the next key resistance stands at $100,000, which is a *major psychological level and a likely target for profit-taking.
• A confirmed breakout above $100,000 would likely lead to its all-time high.
• Expect some volatility and possible retracements around this area before further continuation.
Immediate Support: $86,000 (Short-Term Level to Watch)
On the downside, $86,000 remains an important short-term support level. The market has previously respected this area, making it a crucial pivot point.
• If BTC remains above $86,000, it indicates accumulation and potential for another leg higher.
• A breakdown below $86,000 could trigger a pullback toward deeper support zones.
Major Support: $78,000 (Key Downside Level)
The previous higher low structure suggests that $78,000 is the most critical level to hold for bulls. This zone represents strong demand and has held as a significant reversal point in the past.
• If BTC breaks below $78,000, expect further downside movement toward the $72,000-$73,000 region.
• A decline to $72,000-$73,000 would confirm a deeper correction and a potential trend reversal.
Bitcoin Trading Signal: Conclusion & Strategy
Bitcoin is currently *testing a key resistance zone at $94,000-$95,000, and its ability to break above this level will determine its next move. *Holding above $89,000 keeps the uptrend intact, while a break below $78,000 could lead to a further drop.
Bullish Scenario: If BTC breaks and sustains above $95,000, it could rally toward $100,000. Bearish Scenario: A break below $78,000 could see BTC drop to $72,000-$73,000.
Traders should closely monitor volume confirmations and key support-resistance interactions to navigate BTC’s next major move. 🚀
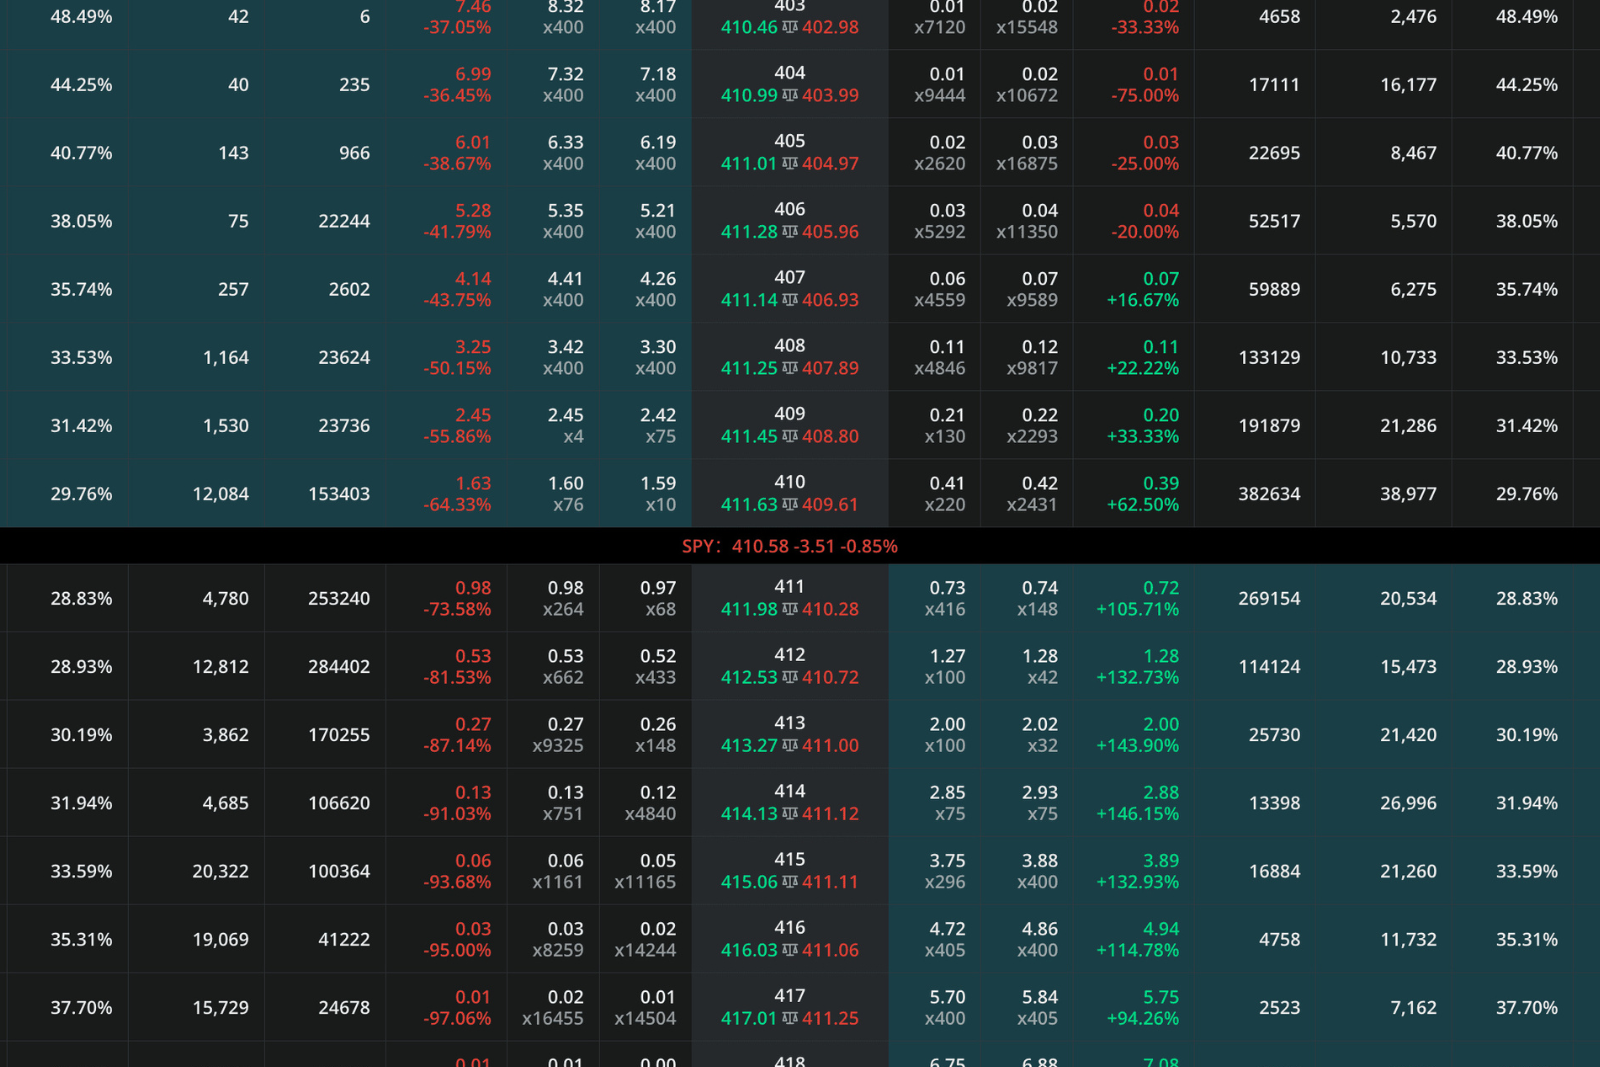
Option chain analysis is a powerful tool that helps traders identify profitable opportunities in the market. Whether you are a beginner or an experienced trader, understanding option chains can give you a strategic edge. In this guide, we’ll break down everything you need to know about option chain analysis, including how to interpret data, key indicators, and actionable strategies to spot winning trades instantly.
What is an Option Chain?
An option chain is a detailed listing of all available option contracts for a particular stock or index. It provides crucial data such as strike prices, bid-ask prices, open interest, and implied volatility, which traders use to make informed decisions.
Key Components of an Option Chain
Strike Price: The predetermined price at which an option contract can be exercised, either to buy (for a call option) or sell (for a put option) the underlying asset.
Expiration Date: The last date on which the option can be exercised.
Bid and Ask Price: The highest price a buyer is willing to pay (bid) and the lowest price a seller is willing to accept (ask).
Open Interest (OI): The total number of outstanding option contracts.
Implied Volatility (IV): The market’s expectations for future volatility.
Volume: The total number of contracts traded during the trading session.
How to Analyze an Option Chain for Winning Trades
1. Identify High Open Interest (OI)
High OI indicates strong interest in a particular strike price, suggesting potential liquidity and price movement. Look for strike prices with the highest OI as they are likely to be key levels of support and resistance.
2. Observe Changes in Open Interest
A sudden increase in OI suggests that new positions are being created, signaling a possible price move. If OI decreases, it could mean traders are closing positions, leading to reduced momentum.
3. Monitor Implied Volatility (IV)
Higher IV means the market expects significant price swings, which can increase option premiums. Low IV suggests stable conditions but may offer cheaper entry points.
4. Watch for Unusual Volume Activity
A sharp increase in volume compared to the average daily volume can indicate strong market sentiment and upcoming price action.
5. Identify the Put-Call Ratio (PCR)
The PCR is calculated by dividing the total put volume by the call volume. A ratio above 1 indicates bearish sentiment, while below 1 suggests bullish sentiment.
6. Analyze Bid-Ask Spread
A narrow bid-ask spread means higher liquidity and lower transaction costs. Avoid options with a wide spread, as they are less liquid and harder to trade profitably.
Actionable Strategies to Use Option Chains Effectively
1. Trend Confirmation Strategy
Use the option chain to confirm existing trends. If call options have higher OI and increasing volume at key resistance levels, it signals strong bullish sentiment. Conversely, rising put OI near support levels indicates bearish sentiment.
2. Reversal Trading Strategy
Identify extreme OI and volume concentrations at specific strike prices. If traders are aggressively buying puts but the stock shows resilience, it could indicate an upcoming reversal.
3. Breakout Strategy
Look for unusual spikes in volume and IV near key strike prices. This suggests an impending breakout, and traders can position themselves using call or put options accordingly.
4. Hedging Strategy
Investors holding stocks can use option chains to hedge against potential losses by purchasing protective puts when IV is low and OI is high.
Conclusion
Mastering option chain analysis can help you spot high-probability trades instantly. By understanding open interest, volume, implied volatility, and strike price activity, you can make more informed trading decisions. Whether you are trading for profits or hedging risks, a well-analyzed option chain can be your gateway to success in the options market.